8 San Francisco Neighborhoods a Loan Can Still Win (2026)
All-cash buyers took three quarters of San Francisco's $6 million-plus single-family sales this year. Under $1.4 million the picture flips. Here are eight neighborhoods where a buyer with a mortgage is still the normal buyer, ranked by current median price.
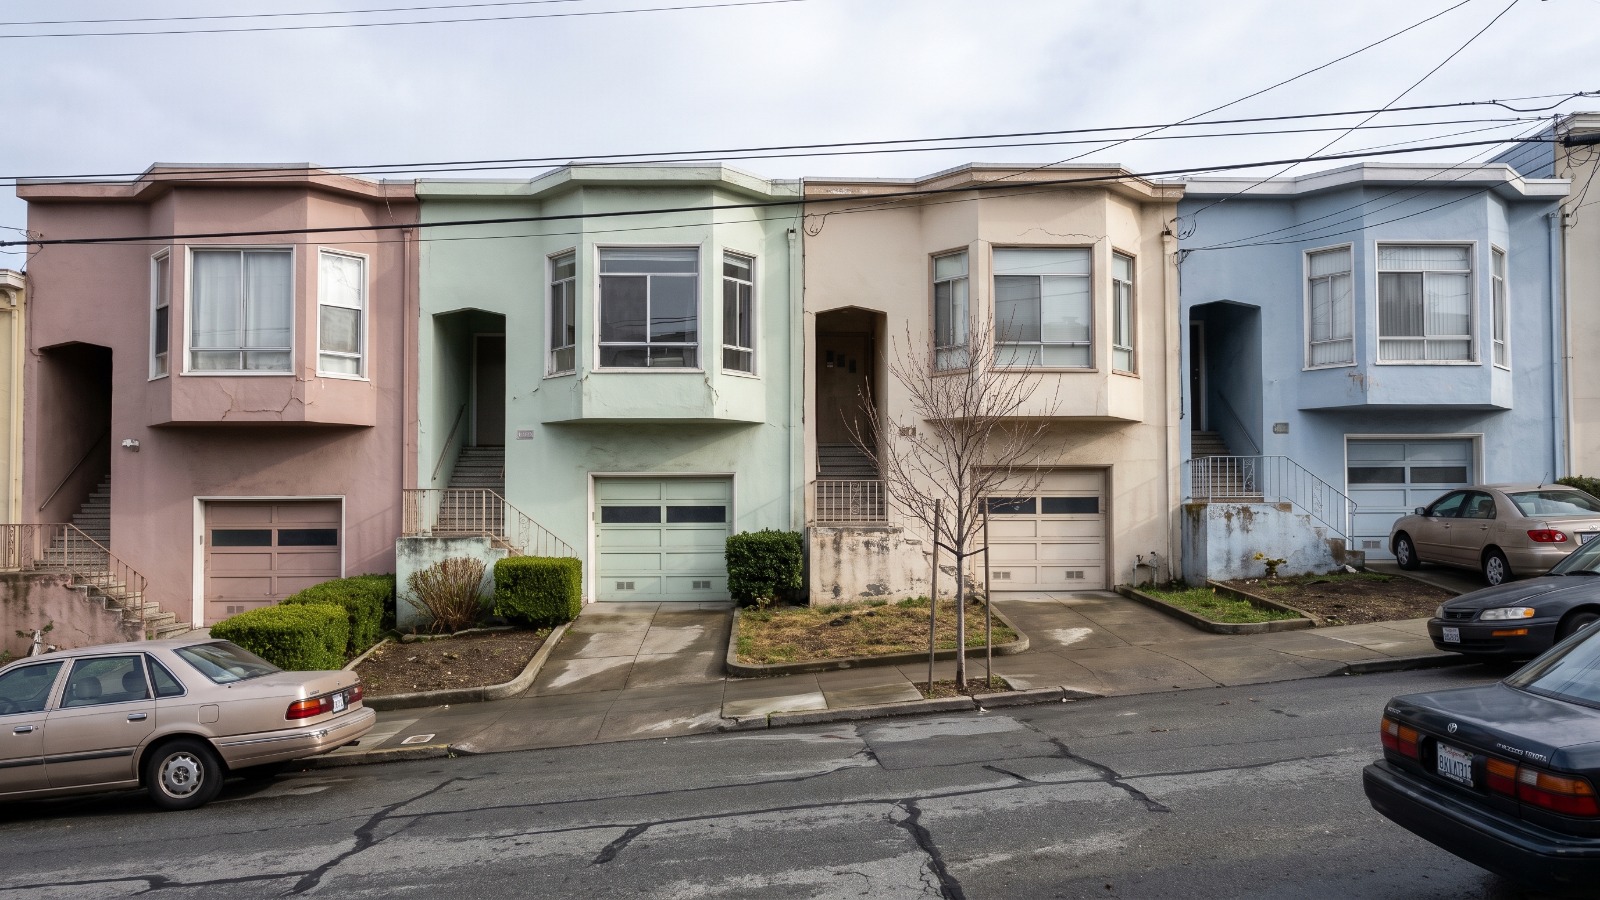
A row of pastel stucco row houses on an Excelsior side street in San Francisco, one of the neighborhoods where financed buyers can still compete in 2026. Photo: Houseberry
Seventy-five percent. That is the share of San Francisco single-family homes above $6 million that sold entirely in cash between January and September this year, per Old Republic Title's read of public records. The median sale price in Bayview was $869,480 in July 2026. The cash wave is real, and it is breaking almost entirely at the top of the market.
Here are eight San Francisco neighborhoods where the median still starts with a zero or a one, cheapest first, and what our scores say you get for it.
First, how big is the cash problem actually
The San Francisco Standard reported on September 20 that about one in three city homes sold for cash this year, the highest share in two decades, with agents saying a financed offer no longer wins without a large premium. Redfin data reported by NBC Bay Area puts Bay Area cash sales at 30 percent from April through June.
Then there is the number nobody led with. Realtor.com's cash-buyer report, published August 18, 2026, put the San Francisco-Oakland-Fremont metro at 24.4 percent cash for the first four months of 2026, below the 31.4 percent national figure. Three of four buyers here still used a mortgage.
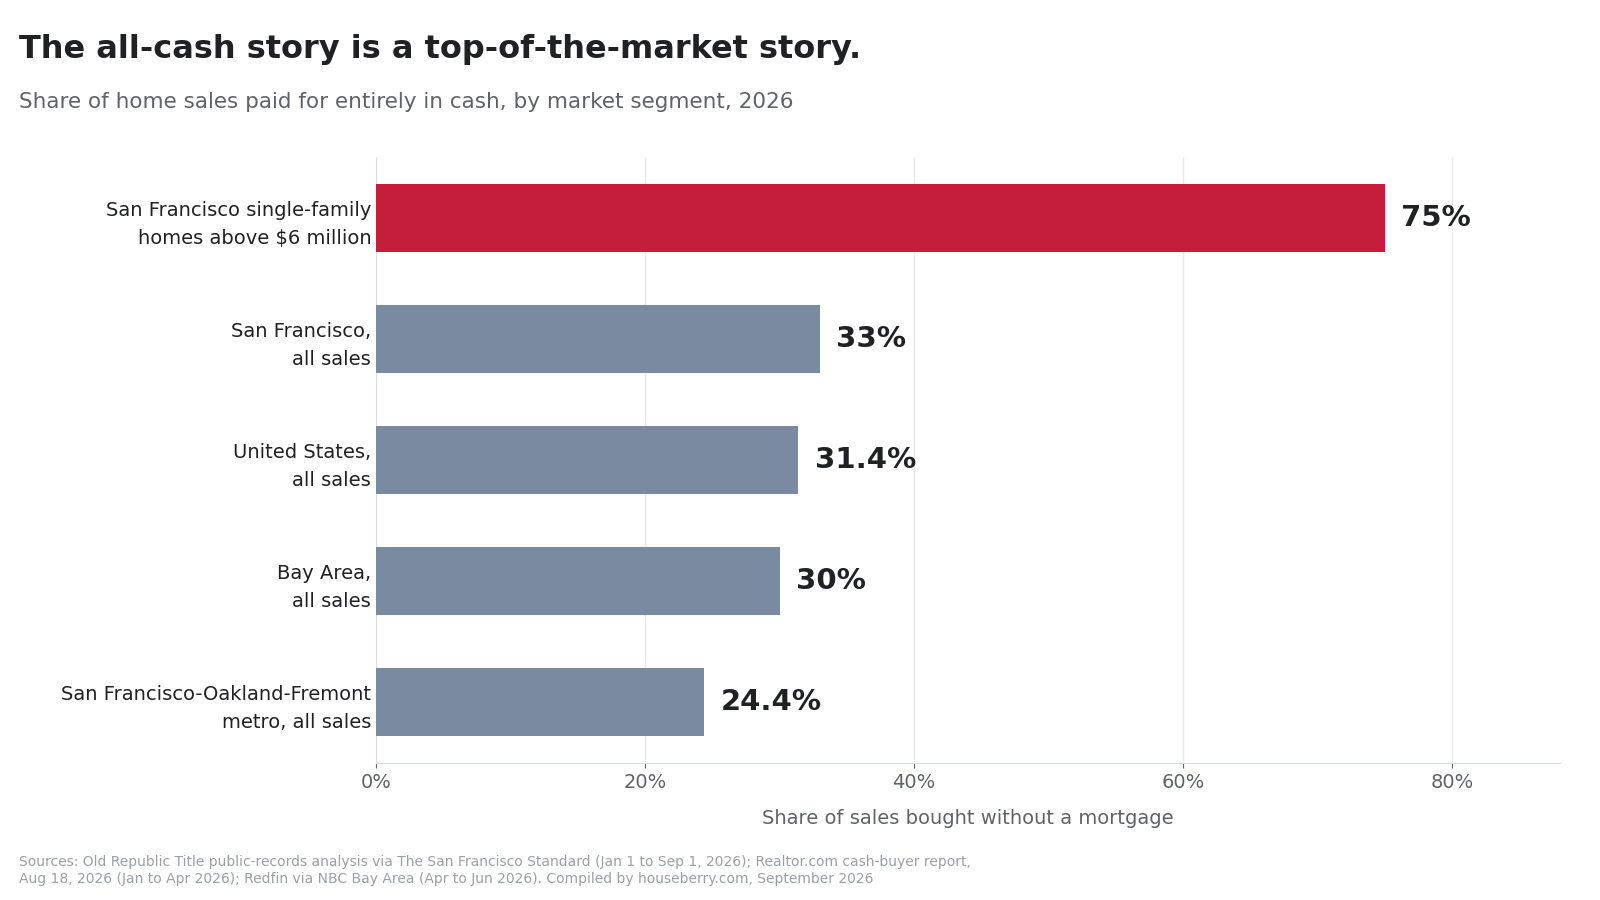
Both are true. Cash dominates the trophy market and thins out fast as prices fall. Realtor.com found more than 40 percent cash above $1 million nationally and a majority above $2 million. Under $1.4 million, financing is still the default.
The eight, cheapest first
- Bayview, $869,480, July 2026
- Silver Terrace, $990,300, July 2026
- Excelsior, $1.05 million, July 2026
- Visitacion Valley, $1.10 million, August 2026
- Crocker Amazon, $1.12 million, July 2026
- Oceanview, $1.15 million, July 2026
- Mission Terrace, $1.23 million, August 2026
- Ingleside, $1.33 million, August 2026
What the eight cost and how they score
Prices come from each neighborhood's own 12-month history, not the snapshot on the ranking page. Scores are out of 5.
| Neighborhood | Median sale price | Overall | Safety | Schools |
|---|---|---|---|---|
| Bayview | $869,480 (July 2026) | 2.4 | 2.4 | 2.4 |
| Silver Terrace | $990,300 (July 2026) | 2.8 | 3.3 | 2.9 |
| Excelsior | $1.05M (July 2026) | 2.6 | 3.4 | 2.0 |
| Visitacion Valley | $1.10M (August 2026) | 2.6 | 3.7 | 1.8 |
| Crocker Amazon | $1.12M (July 2026) | 3.1 | 4.4 | 2.0 |
| Oceanview | $1.15M (July 2026) | 3.1 | 4.4 | 2.3 |
| Mission Terrace | $1.23M (August 2026) | 3.0 | 3.6 | 2.7 |
| Ingleside | $1.33M (August 2026) | 3.6 | 4.2 | 3.5 |
The middle of that list costs $1.11 million, almost exactly half the $2.2 million citywide median we recorded in August 2026. The eight average 3.7 out of 5 on safety against a 3.8 citywide average, so the trade here is amenities and schools, not safety. To sort the whole city this way, our San Francisco neighborhoods ranked by median price page does it live.
1. Bayview, San Francisco
Bayview is the cheapest San Francisco neighborhood we track with a usable price history, at a median of $869,480 in July 2026. It scores 2.4 overall and 1.9 on amenities, the lowest number here. The T Third light rail runs the length of Third Street. The caution is volatility: the median moved between $869,480 and $1.05 million inside twelve months.
2. Silver Terrace, San Francisco
Silver Terrace had a median of $990,300 in July 2026, the only other neighborhood here still under seven figures. It scores 2.8 overall and 3.3 on safety, sitting on the hill between Bayshore Boulevard and Highway 101, which buys freeway access and costs quiet. Its twelve-month range ran from $824,530 to $1.04 million, a thin market that cuts both ways in a negotiation.
3. Excelsior, San Francisco
Excelsior came in at a median of $1.05 million in July 2026, down from $1.14 million a year earlier. That is one of the few genuinely falling medians in the city, which is the condition a financed buyer wants. It scores 2.6 overall and 3.4 on safety, anchored by the Mission Street strip below Silver Avenue. Schools score 2.0, the joint lowest here.
4. Visitacion Valley, San Francisco
Visitacion Valley sat at a median of $1.10 million in August 2026, up from $1.05 million a year before. It scores 2.6 overall with a 3.7 on safety, the best safety figure under $1.1 million in the city. McLaren Park forms its western edge and the T Third terminates at Sunnydale. Schools score 1.8, the lowest number in this article.
5. Crocker Amazon, San Francisco
Crocker Amazon posted a median of $1.12 million in July 2026 and scores 4.4 out of 5 on safety, 62nd of 92 overall at 3.1. It is the cheapest San Francisco neighborhood in our data that clears 4.0 on safety. Crocker Amazon Playground and the Daly City line define its south edge. Schools score 2.0, and the median swung $265,000 this year.
6. Oceanview, San Francisco
Oceanview had a median of $1.15 million in July 2026, with a 4.4 on safety and a 3.1 overall, the second neighborhood here under $1.2 million to clear 4.0 on safety. The M Ocean View line puts downtown within a one-seat ride. Amenities score 2.2, and an October 2025 print of $910,010 shows how thin some months get.
7. Mission Terrace, San Francisco
Mission Terrace finished August 2026 at a median of $1.23 million, down from a $1.46 million peak in May. It scores 3.0 overall, 68th of 92, with 3.6 on safety and a 3.2 on amenities that is the strongest here, and Balboa Park BART is the reason. A median down $230,000 in three months is the clearest negotiating window in this group, though your appraisal may not land where you expect.
8. Ingleside, San Francisco
Ingleside is the highest-scoring neighborhood on this list at 3.6 overall, 42nd of 92, and still closed August 2026 at a median of $1.33 million. Safety scores 4.2 and schools 3.5, the best school figure here by eight tenths of a point, with the Ocean Avenue corridor and City College on its northern edge. The median ran to $1.64 million in April before falling back, so this is the entry most likely to price itself out of reach first.
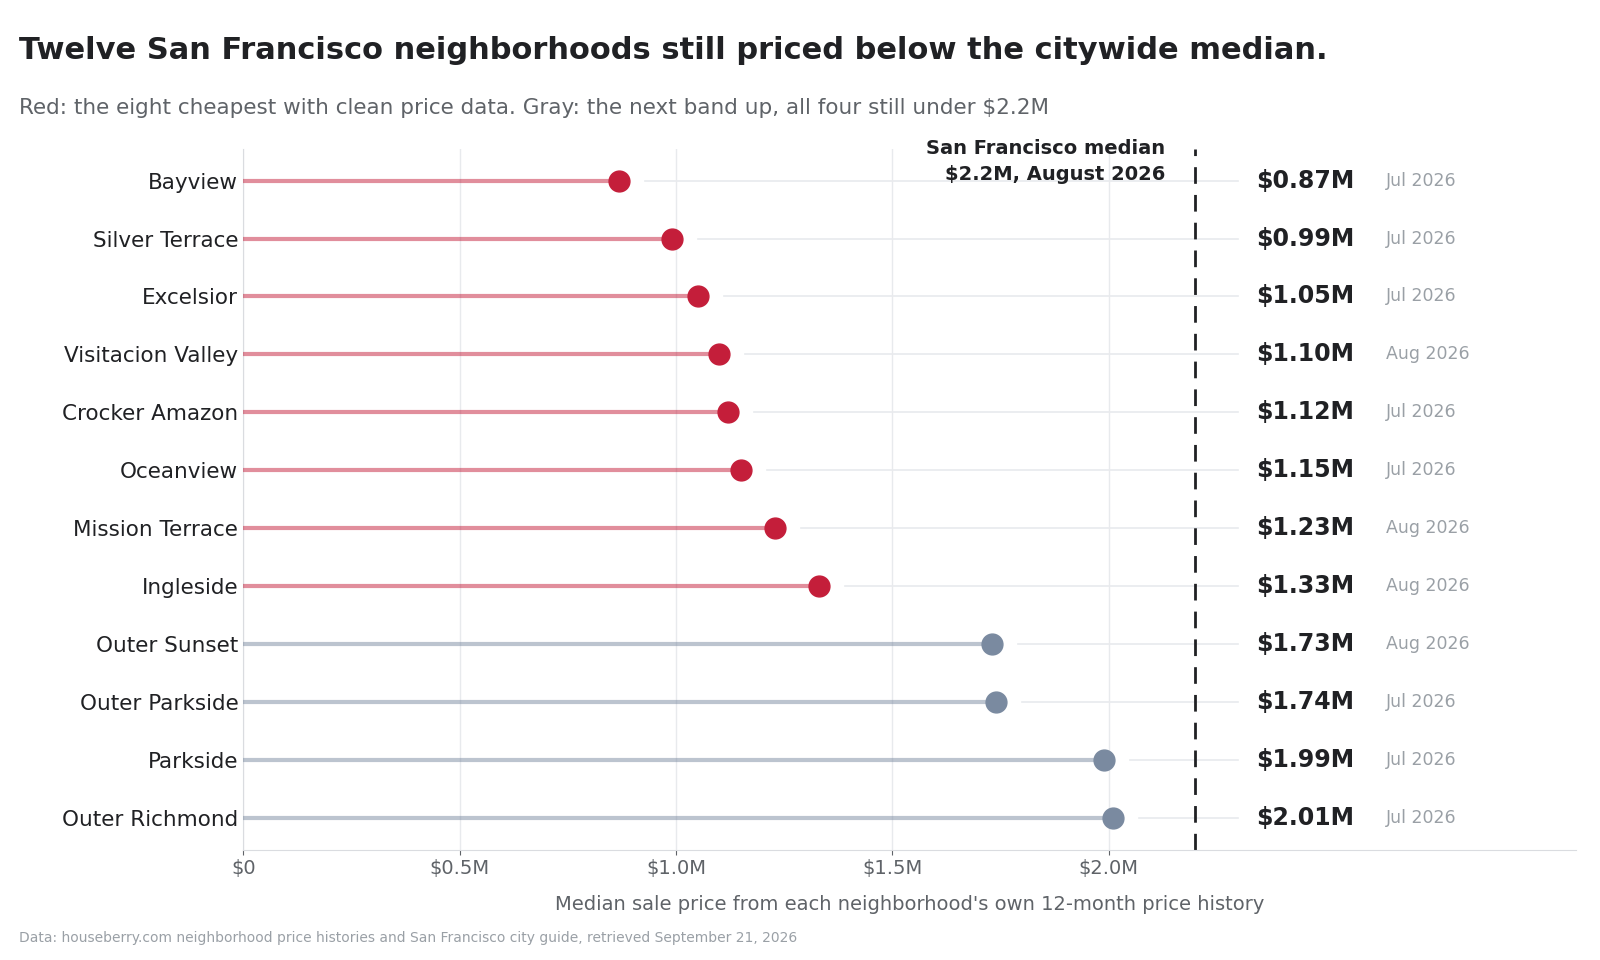
One band up, and still under the city median
Four more are worth a look from anyone who can stretch past $1.7 million. Outer Sunset is the headline: San Francisco's second-highest-scoring neighborhood at 4.2 out of 5, with a median of $1.73 million in August 2026, roughly $470,000 under the city figure. Outer Parkside sat at $1.74 million in July with a 4.5 on safety, Parkside at $1.99 million with a 4.6, and Outer Richmond at $2.01 million with a 4.1 on schools. None of the four scores above 3.9 on amenities.
What the cash number does and does not mean
It does mean that at the top of the market a financed offer competes against a two-week close. If you are shopping Pacific Heights or Presidio Heights, a loan is a real handicap.
It does not mean financed buyers are locked out of San Francisco. A 24.4 percent metro cash share is a market where three in four transactions run through an underwriter, and the national share is falling, from 32.3 percent to 31.4 percent year over year.
What none of it tells us is the cash share inside any one neighborhood. Nobody publishes that. This piece infers competition from price band, which is reasonable and still an inference.
How we built this list
Scores are Houseberry's own. We rate 92 San Francisco neighborhoods from 0 to 5 on overall quality, schools, safety and amenities. The full set sits on our San Francisco neighborhood ranking page. Everything here was retrieved September 21, 2026.
Prices are harder. The price column on a ranking page is a periodic snapshot and can run badly stale. Cole Valley/Parnassus Heights shows $773,609 there while its own history put the July 2026 median at $4.04 million. So every price here comes from a neighborhood's 12-month history or our San Francisco city page, with the month stated.
We pulled histories for 16 neighborhoods and threw out four as unusable: South of Market, which drops from $1.7 million to $860,000 in one month, South Beach, flat at $3.9 million all year, Bayview Heights, which prints $445,840 between a $695,900 and a $962,900, and Candlestick Point, which repeats $900,000. Four more share one identical $2,195,630 figure, the city-level fallback. We ignore the appreciation and value fields.
Questions buyers keep asking about cash offers here
Do I need cash to buy a house in San Francisco in 2026? No. Realtor.com put the San Francisco-Oakland-Fremont metro at 24.4 percent all-cash for January through April 2026, so roughly three in four buyers financed. The share climbs above $2 million and hits 75 percent above $6 million.
What is the cheapest San Francisco neighborhood right now? Bayview, at a median sale price of $869,480 in July 2026, is the lowest of any San Francisco neighborhood we track with a usable price history. Silver Terrace is next at $990,300, also July 2026.
Which affordable San Francisco neighborhood scores best on safety? Crocker Amazon and Oceanview both score 4.4 out of 5, the highest of any San Francisco neighborhood priced under $1.2 million. Their July 2026 medians were $1.12 million and $1.15 million.
Why does the price on your ranking page not match this article? The ranking page price is a periodic snapshot that can lag the market by about a year. Every figure here comes from a neighborhood's own 12-month price history, dated by month.
The practical move
If your budget is under $1.4 million, the cash story in the headlines is mostly somebody else's problem. Pick two or three names off this list, watch how their medians move, and write on the one whose comps are falling rather than the one everyone is talking about.
Sort the city yourself: open our San Francisco neighborhood rankings and put price next to safety and schools before you spend a Saturday on open houses.
Sources: The San Francisco Standard and Old Republic Title, September 20, 2026. Realtor.com cash-buyer report, August 18, 2026. Redfin via NBC Bay Area. Houseberry San Francisco rankings and price histories, retrieved September 21, 2026.
Map of San Francisco Neighborhoods
Loading map...
View Full Map
Top Neighborhoods in San Francisco, CA


All information provided on this website including but not limited to - school ratings, safety, amenities, user opinions, and property data - is for general informational purposes only. We do not guarantee its reliability, accuracy, or completeness. Users should independently verify information and consult appropriate professionals as needed. By using this website, you agree Houseberry is not responsible for actions, decisions, or consequences arising from reliance on the information provided
houseberry.com - CA DRE# 01847391
 Bay East ©2025. CCAR ©2025. bridgeMLS ©2025. Information Deemed Reliable But Not Guaranteed. This information is being provided by the Bay East MLS, or CCAR MLS, or bridgeMLS. The listings presented here may or may not be listed by the Broker/Agent operating this website. This information is intended for the personal use of consumers and may not be used for any purpose other than to identify prospective properties consumers may be interested in purchasing. Data last updated at September 21, 2026 12:00 AM