East Bay Rent Caps 2026: Five Cities, Five Numbers
Richmond's annual rent cap reset to 1.5 percent this month. Oakland, Berkeley, Alameda, Hayward and the statewide AB 1482 cap all sit at different numbers. Here is every East Bay rent cap with the window it covers.
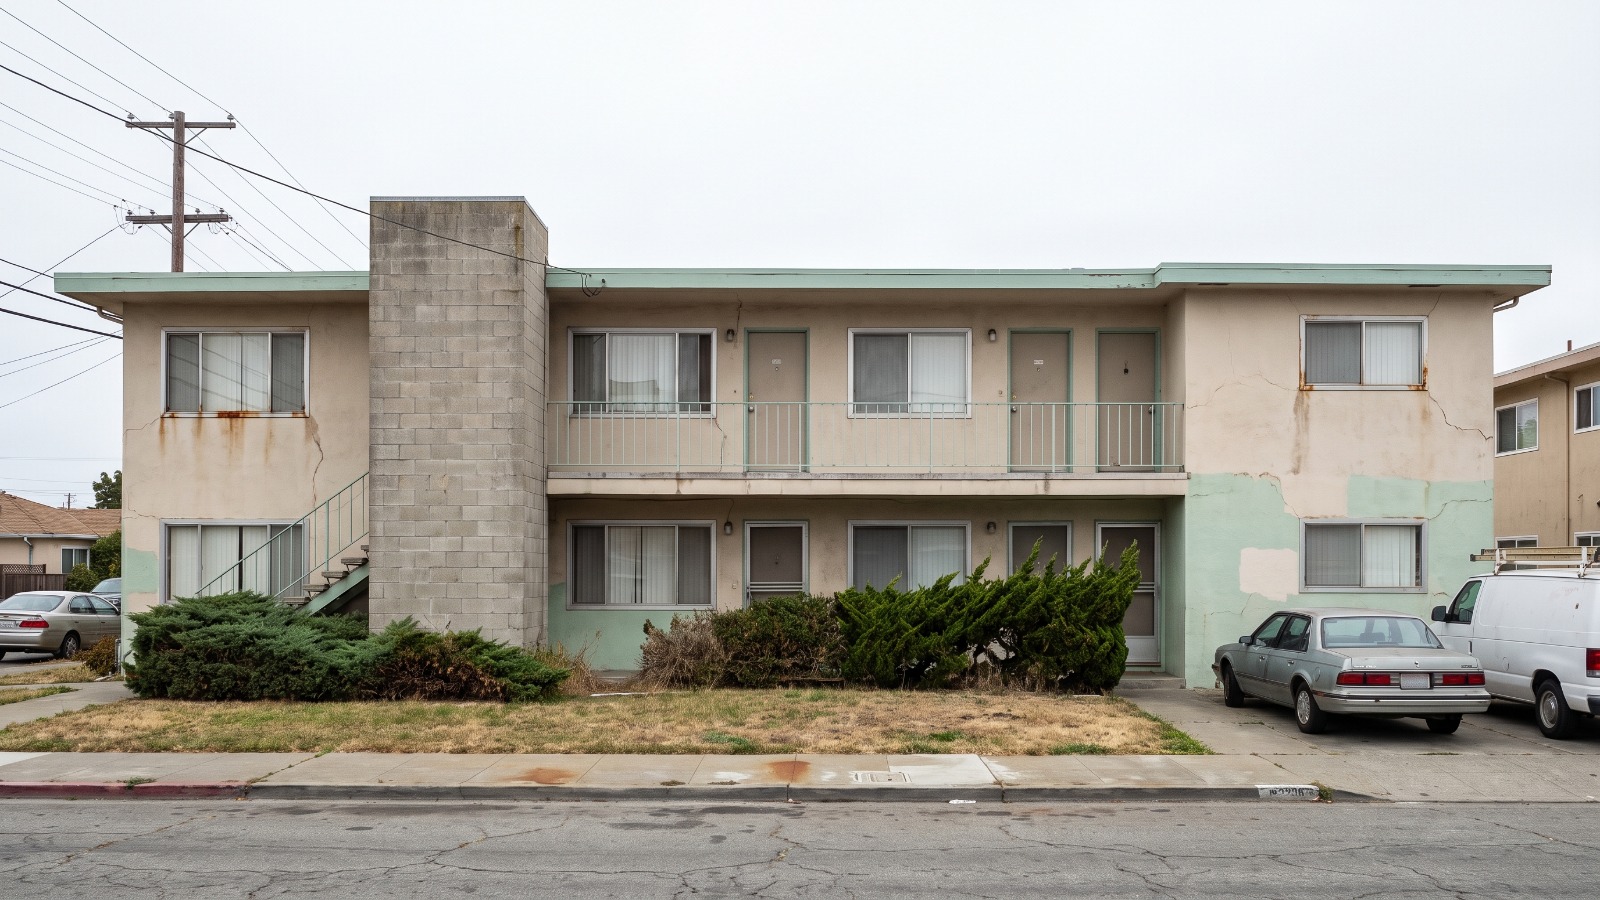
A mid-century two-story stucco walk-up apartment building on a Richmond, California residential street, the kind of older East Bay building covered by local rent caps. Photo: Houseberry
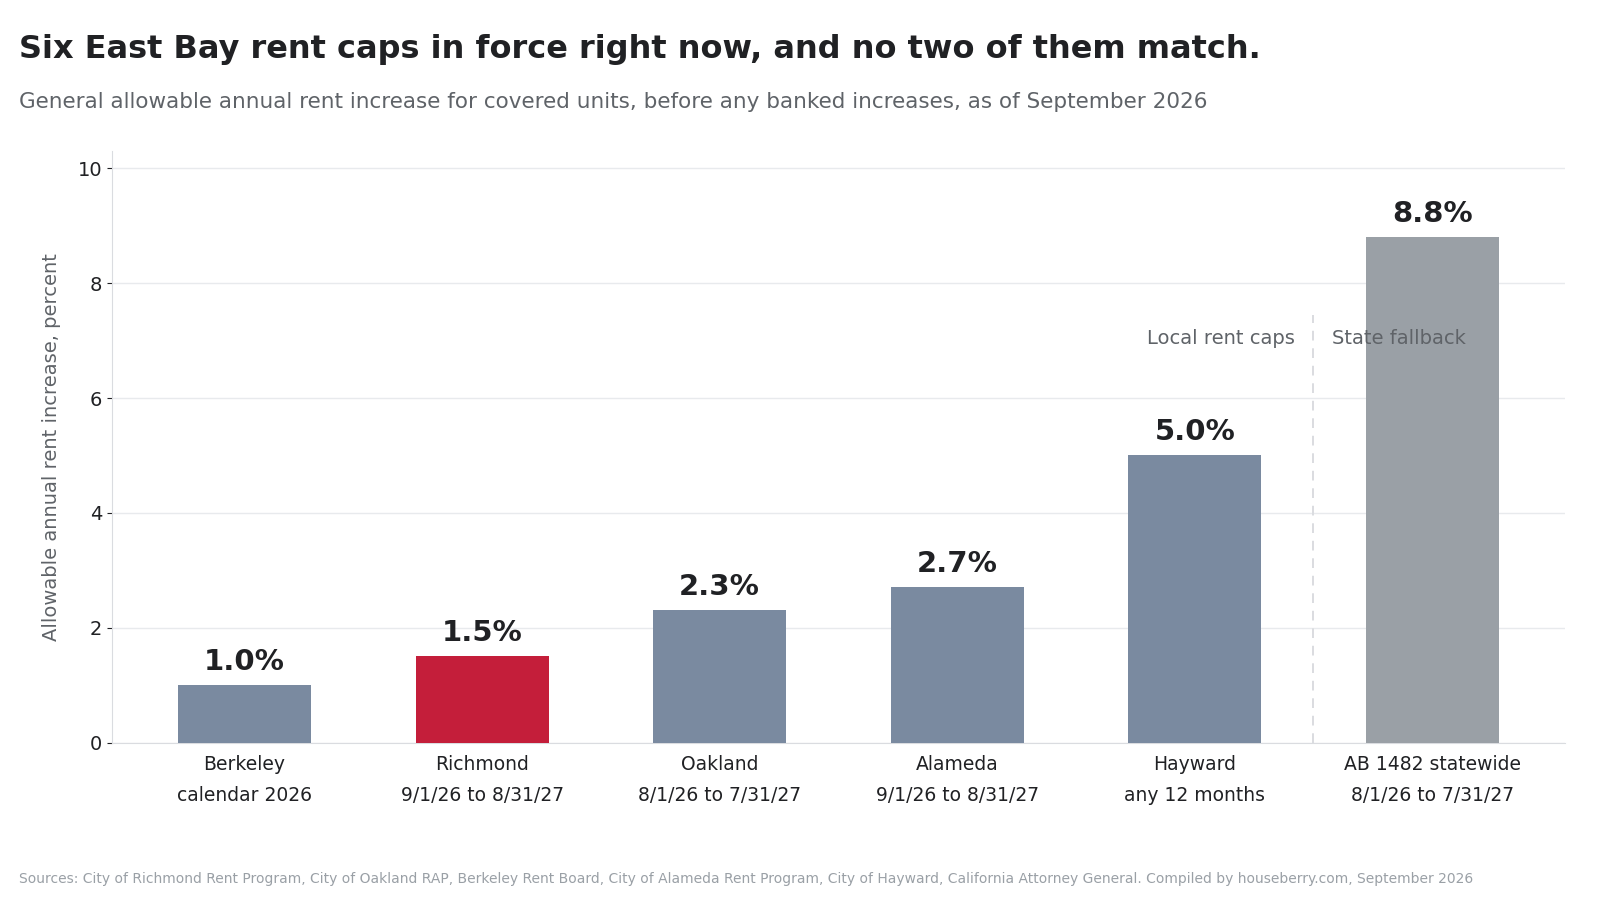
Richmond's annual rent cap reset to 1.5 percent on September 1, and if you rent a covered apartment there, that is the whole increase your landlord can take this year. Drive fifteen minutes and the number changes. Oakland is at 2.3 percent. Berkeley is at 1.0. Alameda is at 2.7. Hayward allows 5. Anything the local ordinances do not reach falls to California's AB 1482 cap, at 8.8 percent.
Five East Bay cities, five different ceilings, and a state backstop almost nine times the strictest of them. Below is every East Bay rent cap we confirmed against the city's own rent program, each with the window it covers. A cap quoted without its dates is wrong inside a year.
East Bay rent caps, city by city
The construction date decides more than the percentage does. Every ordinance below draws a line at a year built, and a building on the wrong side of it is not covered at all.
| City or law | Allowable increase | Period it covers | What it covers |
|---|---|---|---|
| Richmond | 1.5 percent, up to 6.5 percent with banked increases | Sep 1, 2026 to Aug 31, 2027 | Multi-unit properties on one parcel permitted before Feb 1, 1995. Single-family homes, condos and subsidized units are exempt. |
| Oakland | 2.3 percent, up to about 6.9 percent with banking | Aug 1, 2026 to Jul 31, 2027 | Buildings of two or more units with a certificate of occupancy before Jan 1, 1983. Banking is capped at three times the current rate. |
| Berkeley | 1.0 percent, plus any banked prior-year adjustments | Jan 1 to Dec 31, 2026 | Units with a certificate of occupancy before Jun 30, 1980. Unused adjustments bank and can be taken later. |
| Alameda | 2.7 percent | Sep 1, 2026 to Aug 31, 2027 | Two or more units on a legal lot, built before Feb 1995. Set at 70 percent of CPI for the 12 months ending in April. |
| Hayward | 5 percent, up to 10 percent with banking | Any 12-month period | Units with a certificate of occupancy before Jul 1, 1979. Banked increases expire after 10 years. |
| AB 1482, statewide | 8.8 percent | Aug 1, 2026 to Jul 31, 2027 | Most rentals older than 15 years that no stricter local cap reaches. Single-family homes and condos are largely exempt. |
| San Leandro, from 2027 | Lower of 3 percent or 65 percent of CPI | Begins Jan 1, 2027 | Covered residential units under Ordinance 2026-001, measured from the rent in effect July 1, 2025. |
One honesty note. Oakland's 2.3 percent comes from the California Attorney General's rent cap listing, because the city's own 2026 information sheet would not load when we checked. The other four come straight off the city pages. Confirm any of these with the city before you act on it.
Why one building gets 1.5 percent and the one next door gets 8.8
The spread is not politics. It is six formulas reading the same inflation data in opposite directions.
AB 1482 is the only one of the six that adds to inflation. Five percent plus the regional cost-of-living change, capped at 10. Every local ordinance discounts inflation instead: Berkeley takes 65 percent of Bay Area CPI, Alameda 70 percent, Oakland the lower of 60 percent of CPI or a flat 3 percent.
So when inflation runs hot, the two systems pull apart fast. The state cap went from 6.3 percent last year to 8.8 this year. Richmond went down to 1.5. Same inflation, opposite directions, and 7.3 points now separate two units on either side of a 1995 permit date.
Berkeley voters also have Measure X on the November ballot, a rewrite of the Rent Stabilization Ordinance that leaves the 65 percent formula alone and adds a hard 10 percent annual ceiling. Worth its own piece.
What a cap protects, and what it does not
A rent cap protects a tenancy, not a unit. When you move out, Costa-Hawkins lets the owner reset the rent to whatever the market pays, and the next tenant starts from that number with the same 1.5 percent on top.
That is the trade-off worth naming. These ordinances keep a sitting tenant in place and do almost nothing for the person searching today. Coverage also clusters in the oldest stock, since every cutoff above is a construction date.
Richmond's citywide median sale price was about $662,000 in July 2026, the most reachable entry point on the list, and Oakland's was roughly $974,200 in August 2026. The strictest caps and the cheapest for-sale housing landing in the same city is not a coincidence. Both track age of stock. Oakland's 1983 line is not even settled law, as a federal challenge to it showed in August.
Four rent cap questions we get asked constantly
What is a banked rent increase?
An increase the landlord skipped in an earlier year and saved. Richmond, Oakland, Berkeley and Hayward all allow it, each with its own ceiling: Richmond 6.5 percent in one year, Oakland three times the current rate, Hayward 10 percent. Alameda publishes none. A jump well above the posted cap is usually banking, and usually legal.
How do I know if my unit counts as covered housing?
Two questions decide it almost every time. How many units sit on the parcel, and what year the building got its certificate of occupancy. Two or more units plus a date before the city's cutoff and you are probably covered. A detached house or a condo is not.
What happens if my unit is exempt from the local ordinance?
You are not unprotected. AB 1482 caps you at 8.8 percent through July 31, 2027, and requires a stated just cause to end the tenancy after twelve months. A much weaker ceiling than 1.5 percent, but a real one.
How do I check my own unit?
Pull your building's year built and unit count from the county assessor record, free and public, then match it to the row above. If the increase you were handed does not fit, call the city's rent program before you pay it. Richmond, Oakland, Berkeley and Alameda all staff counselors.
How to use this page
Start with two facts about your building, then read one row.
Find the year built and the unit count on the parcel. Match them to the city row. Check today's date against the window in column three, because these numbers roll over on a schedule and Berkeley's resets every January. Then run the arithmetic. On a $2,400 Richmond apartment, 1.5 percent is $36 a month. Under AB 1482, $211.
That $175 a month comes down to a permit date, which is worth knowing before you sign a lease rather than after. Same habit we push at Houseberry: look hard at the block before you fall for the listing photos. Our rankings of the 258 East Bay neighborhoods we score are a reasonable start, and the cap is one more column to carry into that comparison.
We update this page as these numbers reset. Berkeley's 2027 adjustment is next.
Sources
City of Richmond Rent Program, Rent Control and Annual General Adjustment, 1.5 percent effective September 1, 2026, https://www.ci.richmond.ca.us/3376/Rent-Increase
California Attorney General, Limits on Rent Increases, local ordinance table and AB 1482 regional caps, https://oag.ca.gov/rentcaps
Berkeley Rent Board, Annual General Adjustment, 1.0 percent for 2026, https://rentboard.berkeleyca.gov/rights-responsibilities/rent-levels/annual-general-adjustment
City of Alameda Rent Program, Annual General Adjustment effective September 1, 2026, https://www.alamedarentprogram.org/News-articles/Annual-General-Adjustment-announced-effective-September-1-2026
City of Hayward, Summary of the Residential Rent Stabilization and Tenant Protection Ordinance, https://www.hayward-ca.gov/sites/default/files/RRSO-Summary-English_0.pdf
City of Oakland Rent Adjustment Program, Allowable Annual Rent Increase Information Sheet, https://www.oaklandca.gov/Community/Housing-Programs-Support/For-Landlords/Allowable-Rent-Increases/Allowable-Annual-Rent-Increase-Information-Sheet
City of San Leandro Rent Program, Ordinance 2026-001, effective January 1, 2027, https://www.sanleandro.org/1483/Rent-Program
City of Emeryville, Tenant Protection Resources, no local rent cap, https://www.emeryville.org/Services/Housing/Tenant-Resources/Tenant-Protection-Resources
City of Berkeley, November 2026 ballot measures, Measure X, https://berkeleyca.gov/your-government/elections/ballot-measures
Houseberry, Richmond and Oakland city guides and East Bay neighborhood rankings, retrieved September 21, 2026
Map of East Bay Neighborhoods
Loading map...
View Full Map
Top Neighborhoods in East Bay, CA


All information provided on this website including but not limited to - school ratings, safety, amenities, user opinions, and property data - is for general informational purposes only. We do not guarantee its reliability, accuracy, or completeness. Users should independently verify information and consult appropriate professionals as needed. By using this website, you agree Houseberry is not responsible for actions, decisions, or consequences arising from reliance on the information provided
houseberry.com - CA DRE# 01847391
 Bay East ©2025. CCAR ©2025. bridgeMLS ©2025. Information Deemed Reliable But Not Guaranteed. This information is being provided by the Bay East MLS, or CCAR MLS, or bridgeMLS. The listings presented here may or may not be listed by the Broker/Agent operating this website. This information is intended for the personal use of consumers and may not be used for any purpose other than to identify prospective properties consumers may be interested in purchasing. Data last updated at September 21, 2026 12:00 AM