Bay Area Property Tax Rates in 2026 Are Not 1 Percent
Secured property tax bills are landing and the first installment is due November 1. We applied each city's actual tax rate area rate to its current median price to show what that bill really looks like across 14 Bay Area cities.
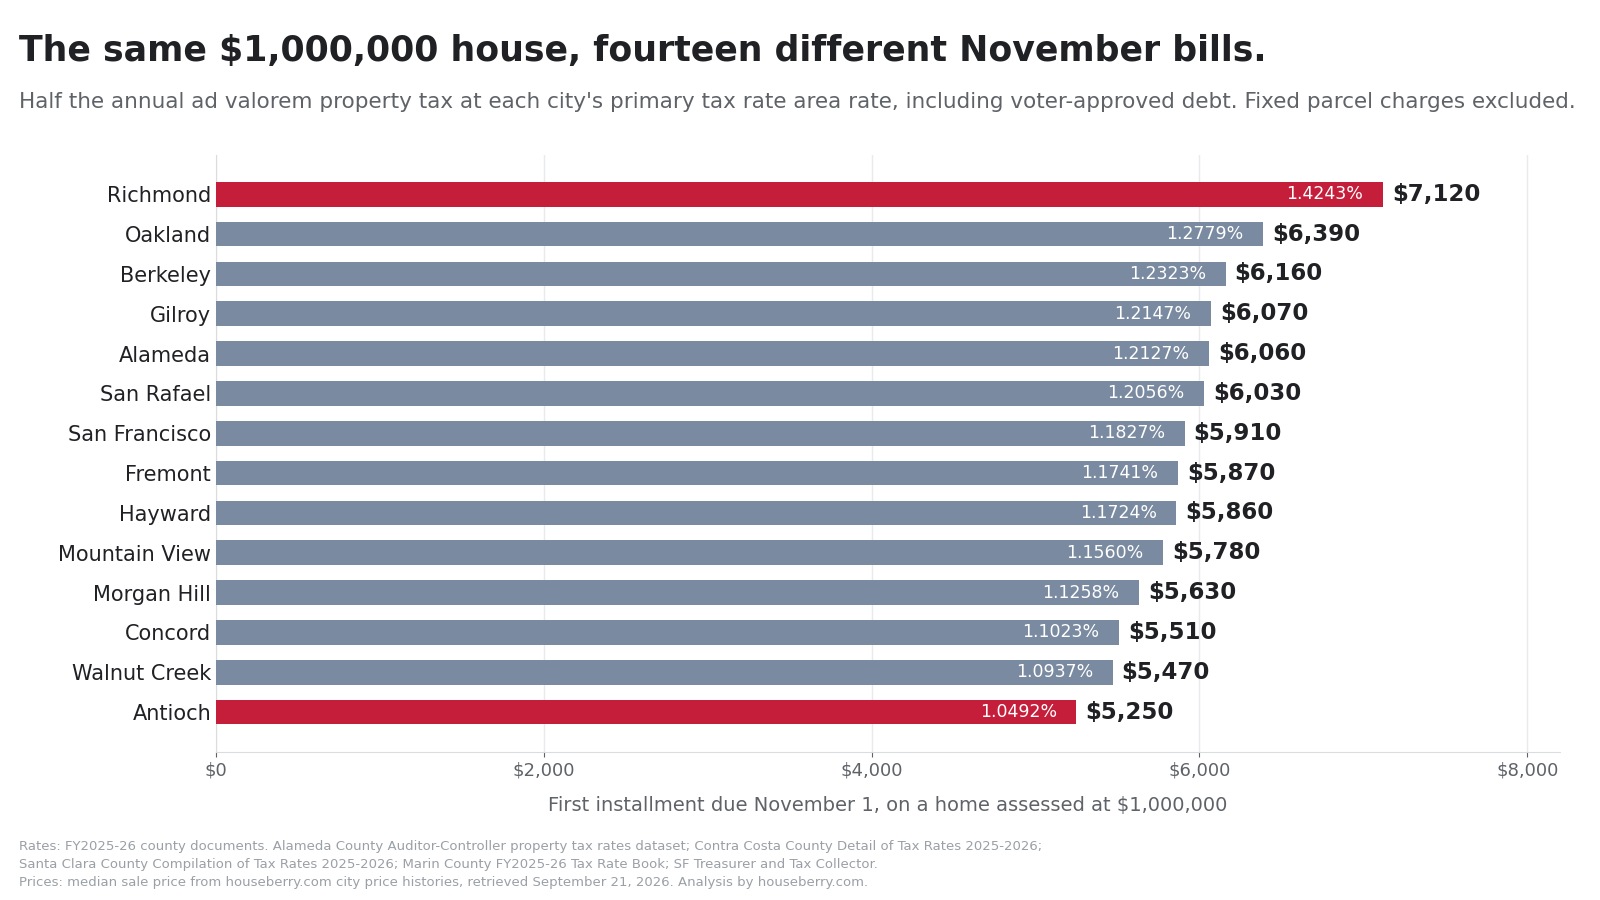
Bar chart comparing the November 1 property tax installment on a $1,000,000 home in 14 Bay Area cities, from Antioch to Richmond. Photo: Houseberry
On an identical $1,000,000 house, the first property tax installment due November 1 is $7,120 in Richmond and $5,250 in Antioch. Same county. Same due date. Same house. The gap is $1,870 every six months, and it comes entirely from the rate.
County tax collectors are mailing secured property tax bills right now. The first installment is due November 1 and goes delinquent after 5 p.m. on December 10. Almost everything written about that deadline repeats the same wrong number, which is 1 percent. One percent is the floor. What you pay is the floor plus whatever bonds and pre-1978 pension obligations your corner of the county voted for, and across the fourteen cities we ran the math on, the total lands between 1.0492 percent and 1.4243 percent.
One warning first, because it is the mistake this whole genre makes. Every figure below describes a home bought at today's median price. It is not what the neighbor who bought in 1994 pays. Under Proposition 13 your assessed value is your purchase price, rising a maximum of 2 percent a year until the house sells again, so most long-time owners are taxed far below market. A median sale price is not an assessed value. These are new-buyer bills.
What the November 1 installment actually looks like, city by city
Here is the whole board. Median sale price from each city's Houseberry price history, the total rate from that city's primary tax rate area, and the arithmetic in between. The November 1 installment is half the annual figure.
| City (county) | Median sale price | Total tax rate, primary TRA | Annual tax | Due November 1 |
|---|---|---|---|---|
| Richmond (Contra Costa) | $662,000, July 2026 | 1.4243% (TRA 08001) | $9,430 | $4,710 |
| Oakland (Alameda) | $974,220, Aug 2026 | 1.2779% (TRA 17-001) | $12,450 | $6,220 |
| Berkeley (Alameda) | $1,730,000, Aug 2026 | 1.2323% (TRA 13-001) | $21,320 | $10,660 |
| Gilroy (Santa Clara) | $1,160,000, Aug 2026 | 1.2147% (TRA 002-000) | $14,090 | $7,050 |
| Alameda (Alameda) | $1,420,000, Aug 2026 | 1.2127% (TRA 21-000) | $17,220 | $8,610 |
| San Rafael (Marin) | $1,310,000, Aug 2026 | 1.2056% (TRA 8-000) | $15,790 | $7,900 |
| San Francisco | $2,200,000, Aug 2026 | 1.18268325% (citywide) | $26,020 | $13,010 |
| Fremont (Alameda) | $1,730,000, Aug 2026 | 1.1741% (TRA 12-001) | $20,310 | $10,160 |
| Hayward (Alameda) | $935,430, July 2026 | 1.1724% (TRA 25-001) | $10,970 | $5,480 |
| Mountain View (Santa Clara) | $2,920,000, July 2026 | 1.1560% (TRA 005-000) | $33,760 | $16,880 |
| Morgan Hill (Santa Clara) | $1,580,000, Aug 2026 | 1.1258% (TRA 004-000) | $17,790 | $8,890 |
| Concord (Contra Costa) | $804,560, Aug 2026 | 1.1023% (TRA 02001) | $8,870 | $4,430 |
| Walnut Creek (Contra Costa) | $1,530,000, June 2026 | 1.0937% (TRA 09000) | $16,730 | $8,370 |
| Antioch (Contra Costa) | $603,780, July 2026 | 1.0492% (TRA 01001) | $6,330 | $3,170 |
Rate sources, in order: the Alameda County Auditor-Controller property tax rates dataset for FY2025-26, the Contra Costa County Detail of Tax Rates 2025-2026, the Santa Clara County Compilation of Tax Rates and Information 2025-2026, the Marin County FY2025-26 Tax Rate Book, and the San Francisco Treasurer and Tax Collector, which publishes one citywide rate for the consolidated city and county.
One percent is a floor, not a rate
Proposition 13 caps the general levy at 1 percent of assessed value. It does not cap what sits on top of it.
The Legislative Analyst's Office splits a property tax bill into three parts: the 1 percent charge, voter-approved debt rates for pre-1978 pension obligations and post-1986 bonds, and direct levies charged on something other than assessed value. The middle piece is what makes one city cost more than another.
Oakland is a clean example. Its main tax rate area, 17-001, stacks a county bond at 0.0084 per $100, Oakland Unified school bonds at 0.0900, Peralta community college bonds at 0.0432, BART at 0.0152, East Bay Regional Park at 0.0011, and the City of Oakland's own voter-approved levy at 0.1200. Add them to the 1.0000 and you get 1.2779, which on Oakland's August 2026 median of $974,220 is $12,450 a year. Every one of those passed at a ballot box, and none of them appears in the 1 percent people quote.
Why the cheapest cities often carry the heaviest rates
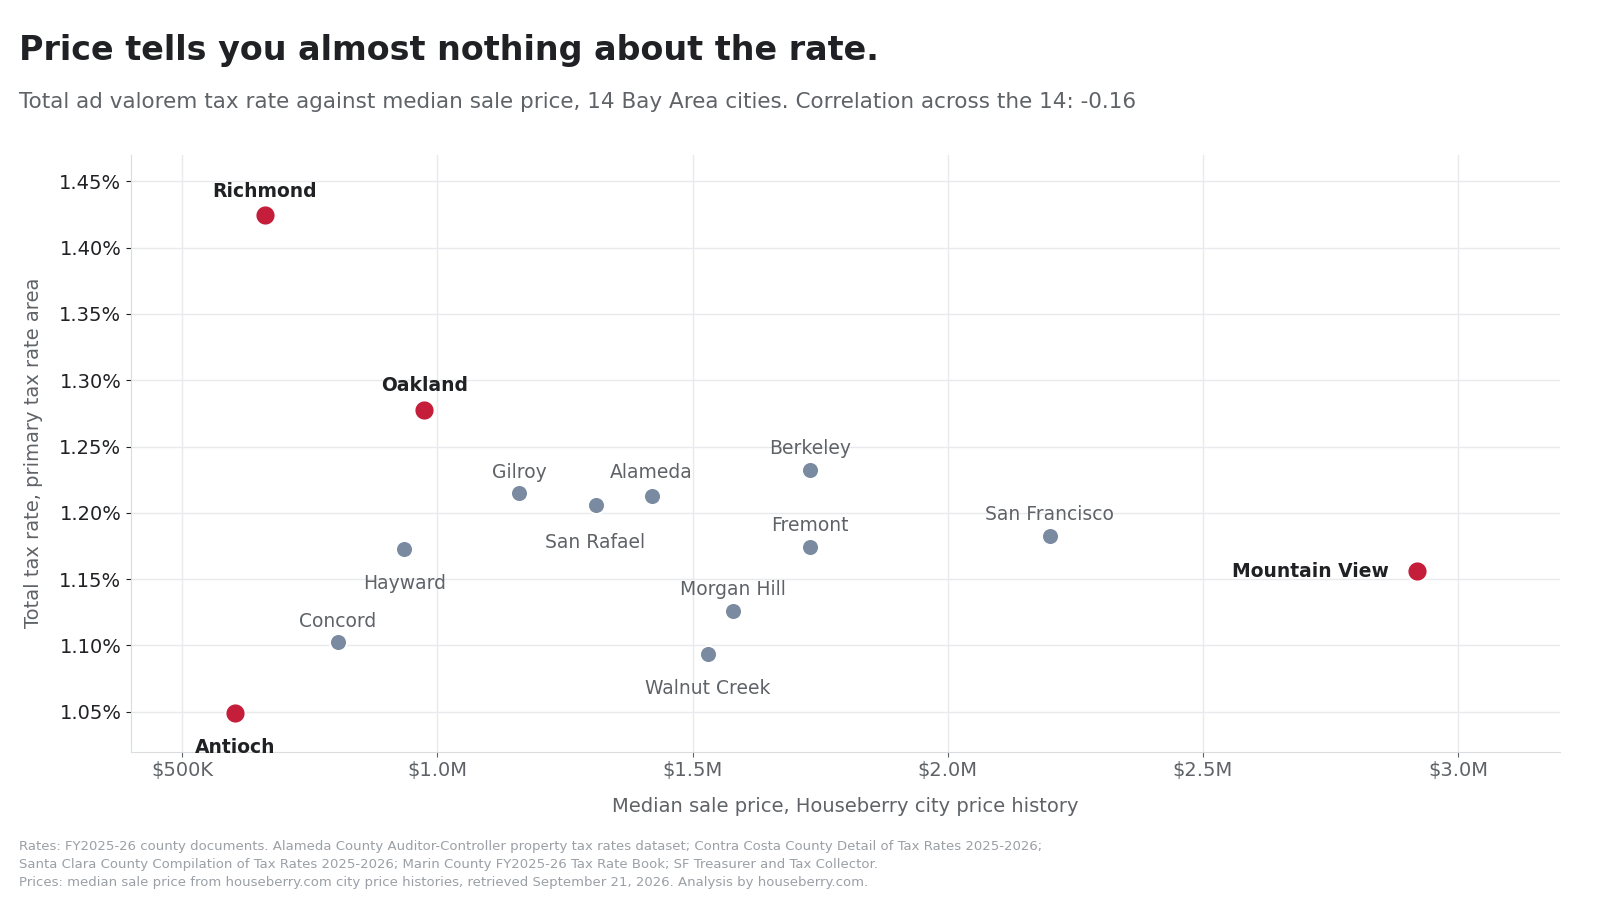
A bond rate is not chosen. It is arithmetic, and the arithmetic punishes places with less property value to spread the debt across.
The rate for a voter-approved bond is that year's debt payment divided by the assessed value of everything inside the district. Two districts that borrowed the same amount charge very different rates if one sits on a much larger assessment roll. A city of $600,000 houses needs a bigger number to raise the same dollars as a city of $2.9 million houses.
Richmond carries a second thing on top of that. Contra Costa's rate book lists a Richmond pension tax of 0.1400 per $100, one of the pre-1978 obligations the state describes, a promise made before Proposition 13 existed. That single line is larger than Concord's entire package of voter-approved add-ons, which totals 0.1023. Richmond owners are still paying for a pension deal older than the tax system itself, and it costs them more than every school bond, college bond, park levy and transit measure Concord has passed put together.
Concord houses cost about $142,560 more than Richmond houses. The tax bill is smaller.
Order these fourteen cities by price, then by annual property tax, and the two lists do not match.
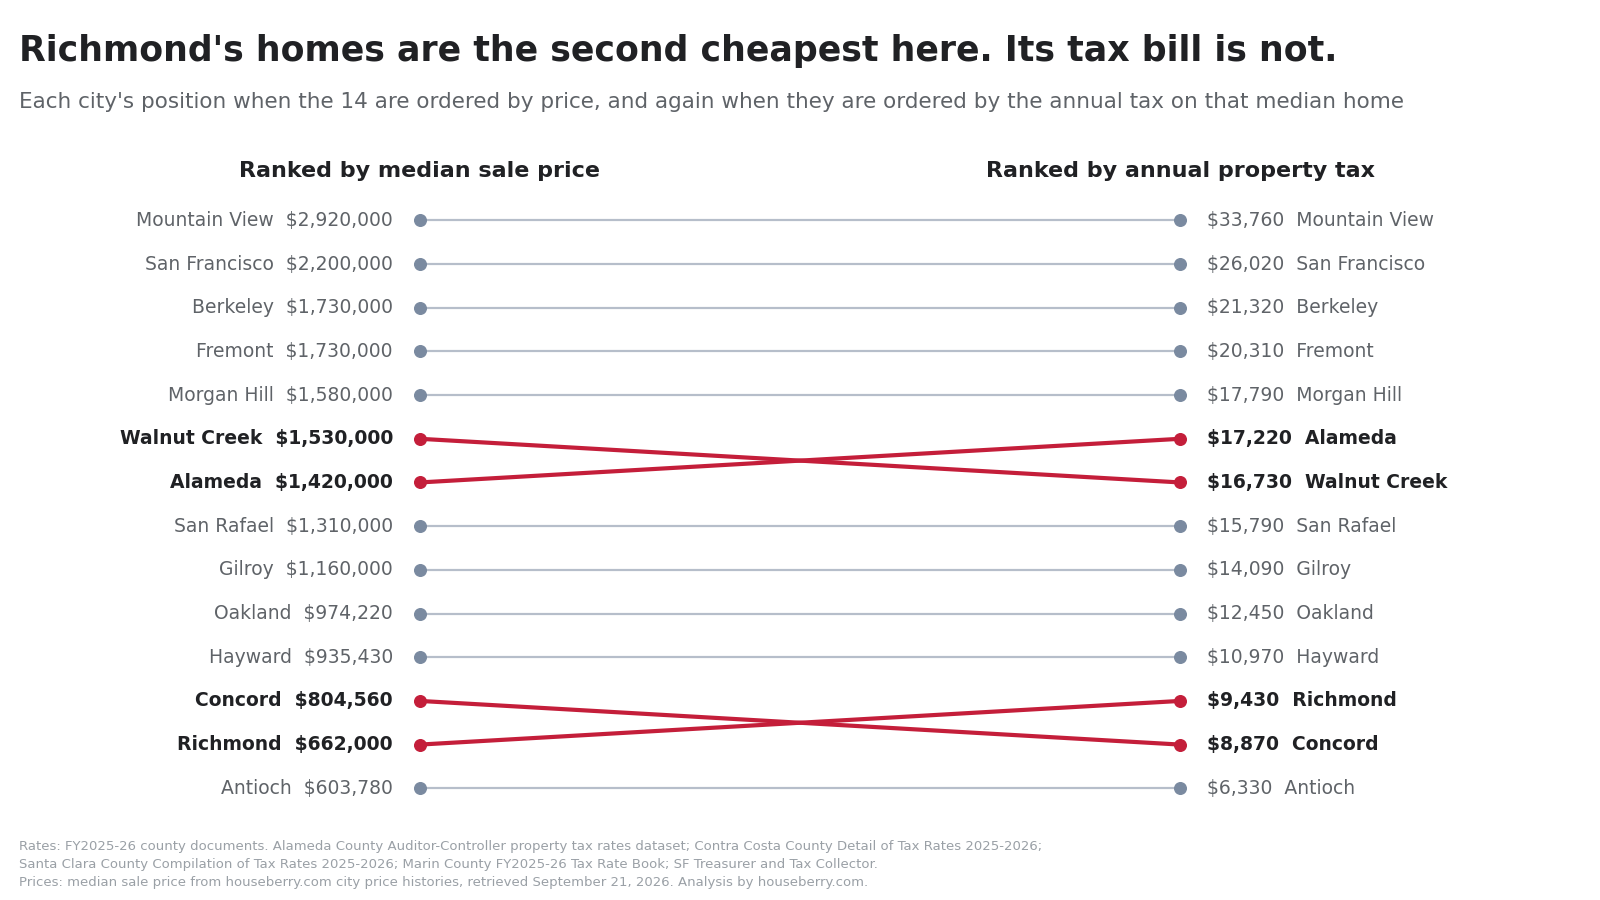
Richmond sits 13th of 14 by median price and 12th by annual tax, passing Concord on the way. The Richmond median home owes about $9,430 a year against Concord's $8,870, even though the Concord house costs roughly $142,560 more. Alameda does the same thing to Walnut Creek, owing $17,220 a year on a $1.42 million median against $16,730 on Walnut Creek's $1.53 million. Two swaps out of fourteen is not chaos. It is enough to matter when you are comparing two offers, and it never shows up on a listing page. To see where the price line falls block by block, our full East Bay ranking by median price runs every scored neighborhood in the region from cheapest to most expensive.
Where the rate stops mattering
Rate differences are worth a few thousand dollars a year. Price differences are worth tens of thousands, and the price wins every time.
Mountain View has the fifth lowest rate of the fourteen at 1.1560 percent and by far the largest bill, $33,760 a year on a $2.92 million median in July 2026. That is $16,880 on November 1, five times Antioch's $3,170, and the rate is working in Mountain View's favor the whole time. So read the rate as a tiebreaker, not a strategy. It decides between two similar houses in two similar towns. It never decides whether you can afford the Peninsula.
What the rate leaves out
Everything above is the ad valorem part of the bill, the part charged as a percentage. The rest of your bill is not a percentage at all.
Parcel taxes, Mello-Roos charges, lighting and landscaping assessments, sewer and vector control lines: those are fixed dollars per parcel. A school parcel tax charges the same amount on a $600,000 cottage and a $3 million house on the next street, which is why folding them into a rate produces a number that is wrong for everybody. We left them out and labelled them out. Depending on your district they add a couple hundred dollars to a few thousand, itemized on your own bill under a heading like special assessments or direct charges. That is the only reliable place to read them.
The number on your bill will not match this table, and here is the main reason
Assessed value. Not the rate.
The LAO puts it plainly in its property tax primer: a property's market value is generally greater than its assessed value, because assessed values rise by at most 2 percent a year while market values tend to rise faster. An Oakland owner who bought in 2003 may be assessed at a third of today's median and pay roughly a third of our table's figure at the same 1.2779 percent rate. The rate is the same for everyone in a tax rate area. The base is not.
Three more caveats. Buy this fall and you will also get a supplemental bill for the gap between the old assessment and yours. The $7,000 homeowners exemption knocks about $80 a year off, and we did not apply it. And these are FY2025-26 rates, because the FY2026-27 rate books were not published as of September 21, 2026. None of this is tax advice, and the only authoritative number is the one printed on your own bill.
What moves these rates before next November
Two things, and they pull in opposite directions.
New voter-approved debt pushes a rate up and retired debt pulls it down, which is why a city's number wobbles year to year. The quieter force is the assessment roll. Because a bond rate is debt service divided by total assessed value, a roll growing faster than the debt service on it pulls rates down with nobody voting on anything, interrupted every time a new measure passes.
Richmond's 0.1400 pension levy is the exception, because it answers to a pre-1978 obligation rather than a bond schedule. It is the most durable line in this comparison. We will re-run the table when the FY2026-27 books post, and the number to watch is whether Richmond's gap over Antioch widens past 0.3751 points.
How we did the math
Fourteen cities across five counties: Alameda, Contra Costa, Santa Clara, Marin and San Francisco. For each we took the total rate printed for that city's primary tax rate area in the county's own FY2025-26 rate document, listed above: the 1 percent general levy plus voter-approved debt service. Tax rate areas vary inside a city, so treat each figure as that city's main rate, not a rate every parcel pays. Median prices come from our city price histories, retrieved September 21, 2026, with the month stated alongside every figure. We dropped one city, Los Gatos, whose twelve-month series sat flat at $4.01 million for seven straight months and then fell 35 percent in a single step, which reads as a small-sample artifact rather than a market.
Three exclusions. Fixed special assessments, because they are per-parcel dollars and not a rate. Santa Clara County prints its Valley Water State Water Project levy of 0.00390 separately from the tax rate area total and we followed the county, so add about $39 per $1 million of assessed value there. Contra Costa's printed totals likewise exclude a land-only water levy of 0.0018. And once more, because it is the error everyone makes: a median sale price is not an assessed value.
Questions people are asking about the November bill
When is the first installment due, and when is it late?
The first installment of the 2026-27 secured property tax is due November 1, 2026 and is delinquent after 5 p.m. on December 10, 2026, after which a 10 percent penalty attaches. The second installment is due February 1, 2027 and delinquent after April 10, 2027. Alameda County's tax collector notes that if a delinquency date falls on a weekend or legal holiday the deadline moves to the next business day. December 10, 2026 is a Thursday, so there is no extension this year.
Why is my property tax rate higher than 1 percent?
Because Proposition 13 caps only the general levy. Voter-approved school, community college, city, park and transit bonds are charged on top of it, as are pension obligations approved before 1978. Those add-ons range from 0.0492 points in Antioch to 0.4243 points in Richmond among the cities here.
How much are property taxes in San Jose?
There is no single San Jose number, which is why the answers online disagree. The city spans San Jose Unified, East Side Union, Alum Rock, Berryessa, Oak Grove and more, and each combination is its own tax rate area with its own bond stack. Look up your parcel's tax rate area in the Santa Clara County rate book rather than trusting a citywide average. For scale, the Santa Clara County cities in our table run 1.1258 to 1.2147 percent.
Does buying a house change the tax bill right away?
Yes. The county reassesses at your purchase price and sends a supplemental bill for the difference between the seller's assessment and yours, covering the rest of the fiscal year. That is the bill that surprises first-time buyers in the spring.
Which Bay Area city in this comparison has the lowest property tax rate?
Antioch, at 1.0492 percent in tax rate area 01001, then Walnut Creek at 1.0937 and Concord at 1.1023. All three sit in Contra Costa County, the same county as Richmond, which is the tell that rates follow districts and bond history, not county lines.
Before you compare two offers this fall
Run the rate before you run the mortgage calculator. A 0.3751 point spread is roughly $3,750 a year on a million-dollar house, about what buyers argue over when they argue about an eighth of a point on a mortgage, and unlike the mortgage it never refinances away.
Then go back to the part that matters more than either number. The rate is a line on a bill. The block is what you live on, and comparing blocks before anyone falls in love with an address is the whole reason we built Houseberry. Open our Richmond neighborhood rankings next to the same rankings for Concord and see what that extra 0.3220 points of tax rate is actually buying.
Sources
Alameda County Auditor-Controller, Property Tax Rates FY25-26 dataset, Alameda County Open Data, retrieved September 21, 2026
Alameda County Auditor-Controller, Property Tax Reports (2026-27 tax rate book listed as not yet available), retrieved September 21, 2026
Alameda County Treasurer and Tax Collector, property tax FAQs, retrieved September 21, 2026
Contra Costa County, Detail of Tax Rates 2025-2026, October 2025
County of Santa Clara Controller-Treasurer, Compilation of Tax Rates and Information, Fiscal Year 2025-2026
County of Marin, FY2025-26 Tax Rate Book, Distribution of Tax Dollars
San Francisco Treasurer and Tax Collector, Secured Property Taxes, retrieved September 21, 2026
California Legislative Analyst's Office, Understanding Your Property Tax Bill, EconTax Blog
California Legislative Analyst's Office, Understanding California's Property Taxes, November 2012
California State Board of Equalization, Homeowners' Exemption
Houseberry city price histories for the 14 cities cited, retrieved September 21, 2026
All information provided on this website including but not limited to - school ratings, safety, amenities, user opinions, and property data - is for general informational purposes only. We do not guarantee its reliability, accuracy, or completeness. Users should independently verify information and consult appropriate professionals as needed. By using this website, you agree Houseberry is not responsible for actions, decisions, or consequences arising from reliance on the information provided
houseberry.com - CA DRE# 01847391
 Bay East ©2025. CCAR ©2025. bridgeMLS ©2025. Information Deemed Reliable But Not Guaranteed. This information is being provided by the Bay East MLS, or CCAR MLS, or bridgeMLS. The listings presented here may or may not be listed by the Broker/Agent operating this website. This information is intended for the personal use of consumers and may not be used for any purpose other than to identify prospective properties consumers may be interested in purchasing. Data last updated at September 21, 2026 12:00 AM