SFUSD Lottery Vote: SF Neighborhoods With the Top School Scores
SFUSD's board votes October 13 on what replaces the school lottery. Here is where San Francisco's strongest public school scores sit today, what homes there cost, and why zone lines are not drawn yet.

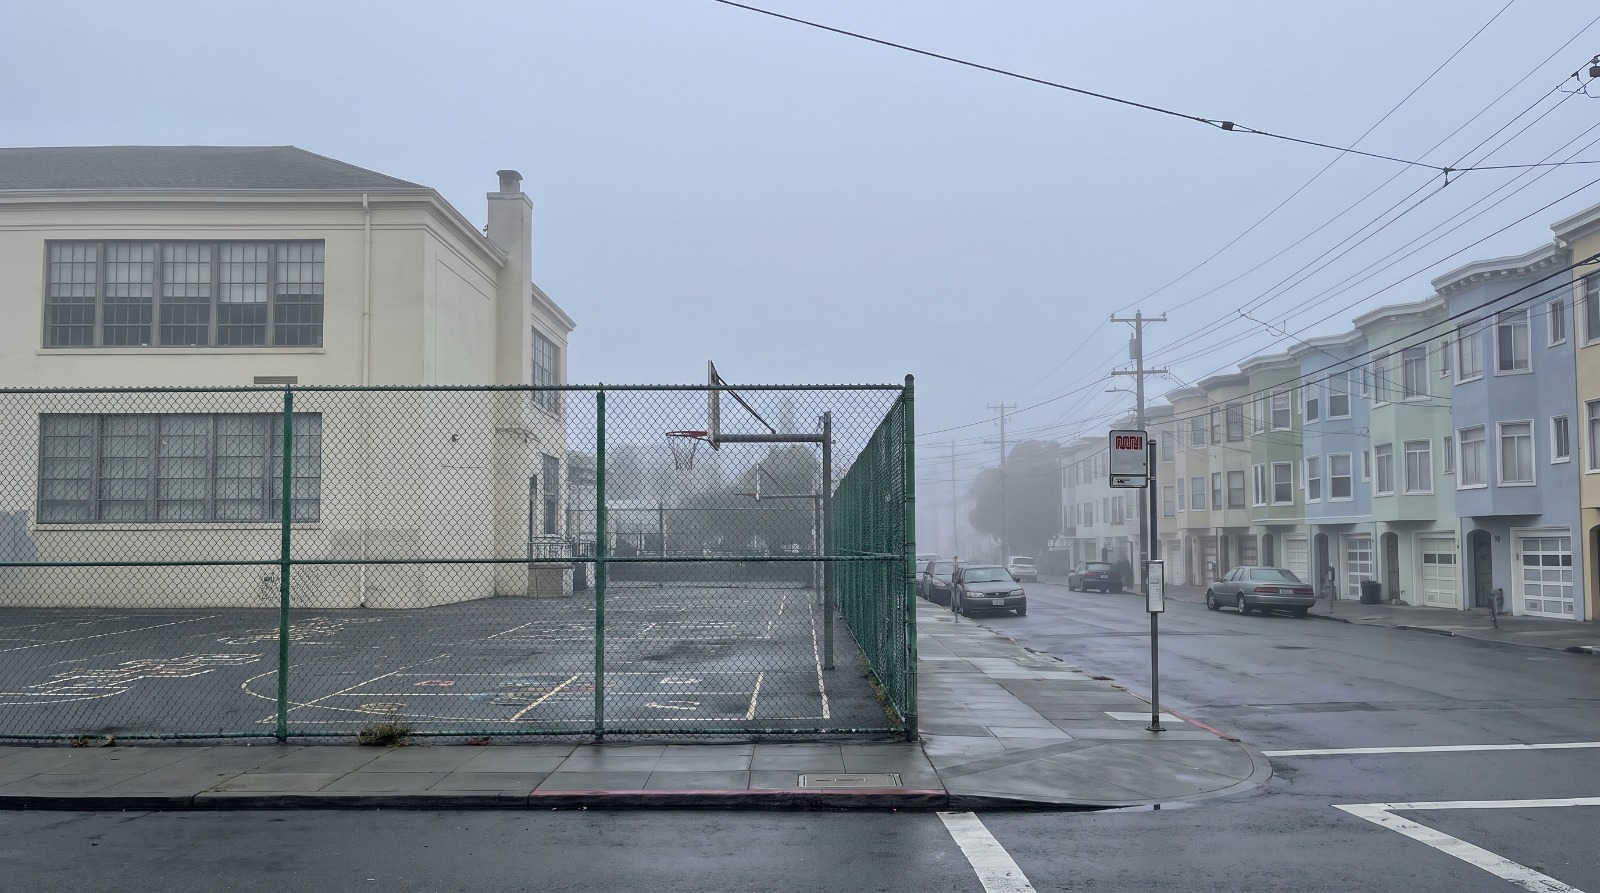
Foggy Richmond District street beside an empty public elementary schoolyard as SFUSD weighs ending its school lottery in San Francisco. Photo: Houseberry
Every January, San Francisco parents sit down with a list of 70-odd elementary schools and rank them, knowing the house they live in only partly decides where their kid ends up. The question I hear most this fall is simple. If the district finally ends the lottery, does my address start to count?
Quite possibly. On October 13 the SFUSD school board votes on a direction for replacing the SFUSD lottery, and two of the three options still on the table guarantee a seat near home. If that is where it lands, the San Francisco neighborhoods with the strongest school scores, most of them on the west side, start to matter to homebuyers in a way they have not since 2011. Nothing is final until April 2027, no zone lines exist yet, and the first students placed under new rules would start in August 2028.
What the SFUSD board is actually voting on October 13
The board is choosing a direction, not a map. SFUSD's own governance calendar lists the October 13 item as the board voting to "confirm enrollment policy direction," and the district's school reorganization page, updated September 21, describes the goal as a system that would promise a seat closer to home while keeping access to programs across the city.
Staff presented four models at a September 1 study session, according to the San Francisco Parent Coalition's meeting summary. Large zones were dropped because the travel distances did not work. That leaves three:
- Small zones. Families choose among roughly two to five schools near home, plus designated citywide programs.
- Neighborhood plus all schools. A guaranteed local school, with the option to apply to any school in the district.
- Neighborhood plus citywide programs. A guaranteed local school, with choice limited mostly to language immersion, magnet and other programs designated as citywide.
Pushing from outside is KTAP, short for Kids, Teachers and Parents, a group launched this week by tech executive John Jersin, former SF Parents staffer Sarah Montoya and two Lowell High teachers. It wants the neighborhood guarantee. The San Francisco Standard reported, and Hoodline followed on October 1, that an internal KTAP poll of 600 voters found 35 percent backing neighborhood zones, 35 percent expanded magnets, 17 percent a simplified lottery and just 2 percent the current system. It is the group's own poll, so treat it as advocacy, but that 2 percent is the clearest read yet on how little love the lottery has left.
One date needs straightening out. Some coverage says the new system will be ready for 2027-28. What the district and the Standard actually describe is a system built during 2027-28, with families applying under the new rules for the 2028-29 school year, which starts in August 2028. That matches our August look at SFUSD school closures, which reported the overhaul had slipped to 2028-29. The date has not moved again. It has just been described loosely.
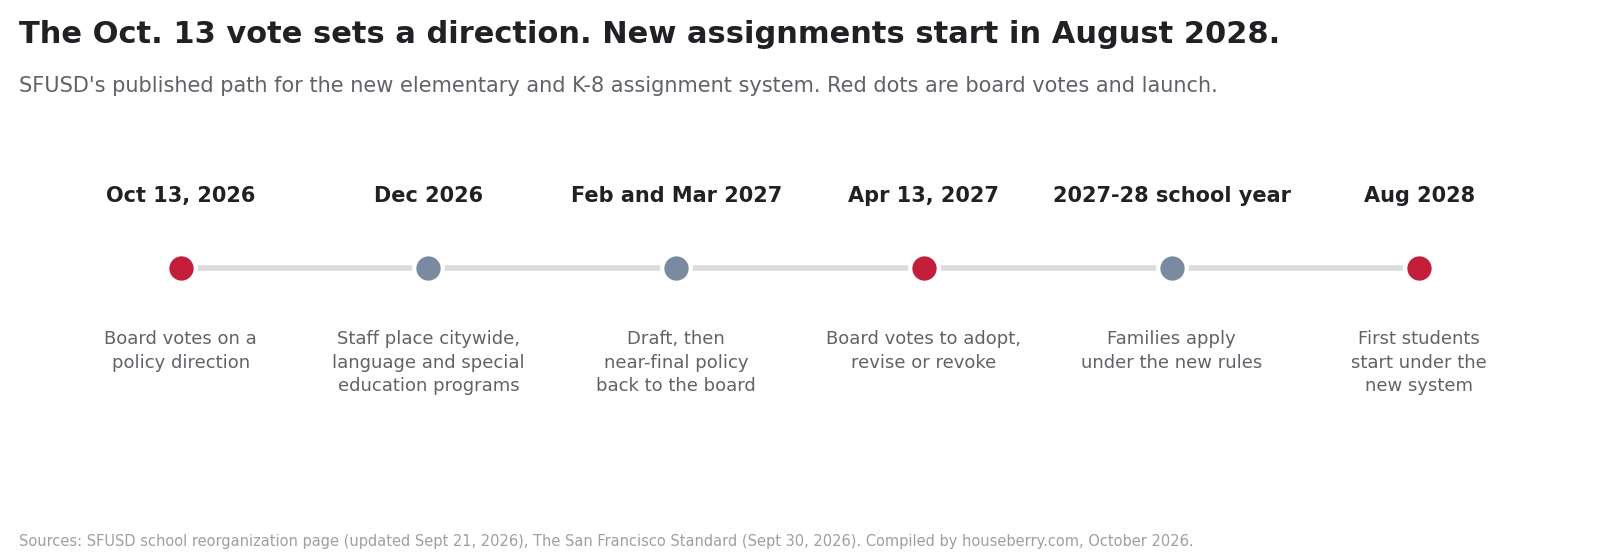
Skepticism is earned here. The board approved a zone-based plan in December 2020 for a 2023 launch. In May, SFUSD governance head Hong Mei Pang told the Standard that simulations showed that 2020 policy "cannot guarantee that students living within a zone would be assigned to a school there," which is why the district is starting over. School closures are sequenced behind the new system, which is why they now sit at no earlier than 2029-30.
How much your address matters under the lottery today
Some, but less than most buyers assume. For an elementary attendance-area school, SFUSD's tiebreakers run in this order: siblings, then pre-K or TK at the same school, then families living in the parts of the city with the lowest average test scores (the CTIP1 tiebreaker), and only then families who live in the attendance area. At citywide schools the attendance area does not count at all.
The current choice system has run since 2011, and KQED reported in August that it has left long waitlists at the most sought-after campuses while others sit underenrolled.
The lottery mostly works, and mostly is the problem. In the 2025-26 cycle, 92 percent of students got one of their ranked choices, but only 69 percent of kindergarten, sixth and eighth grade assignments were a first choice. At Presidio Middle, 87 percent of applicants with the feeder tiebreaker got a seat in recent years, against 3 percent with no tiebreaker at all. So geography already leaks in through feeder patterns. A neighborhood guarantee would make it the main event.
Where San Francisco's strongest public school scores sit right now
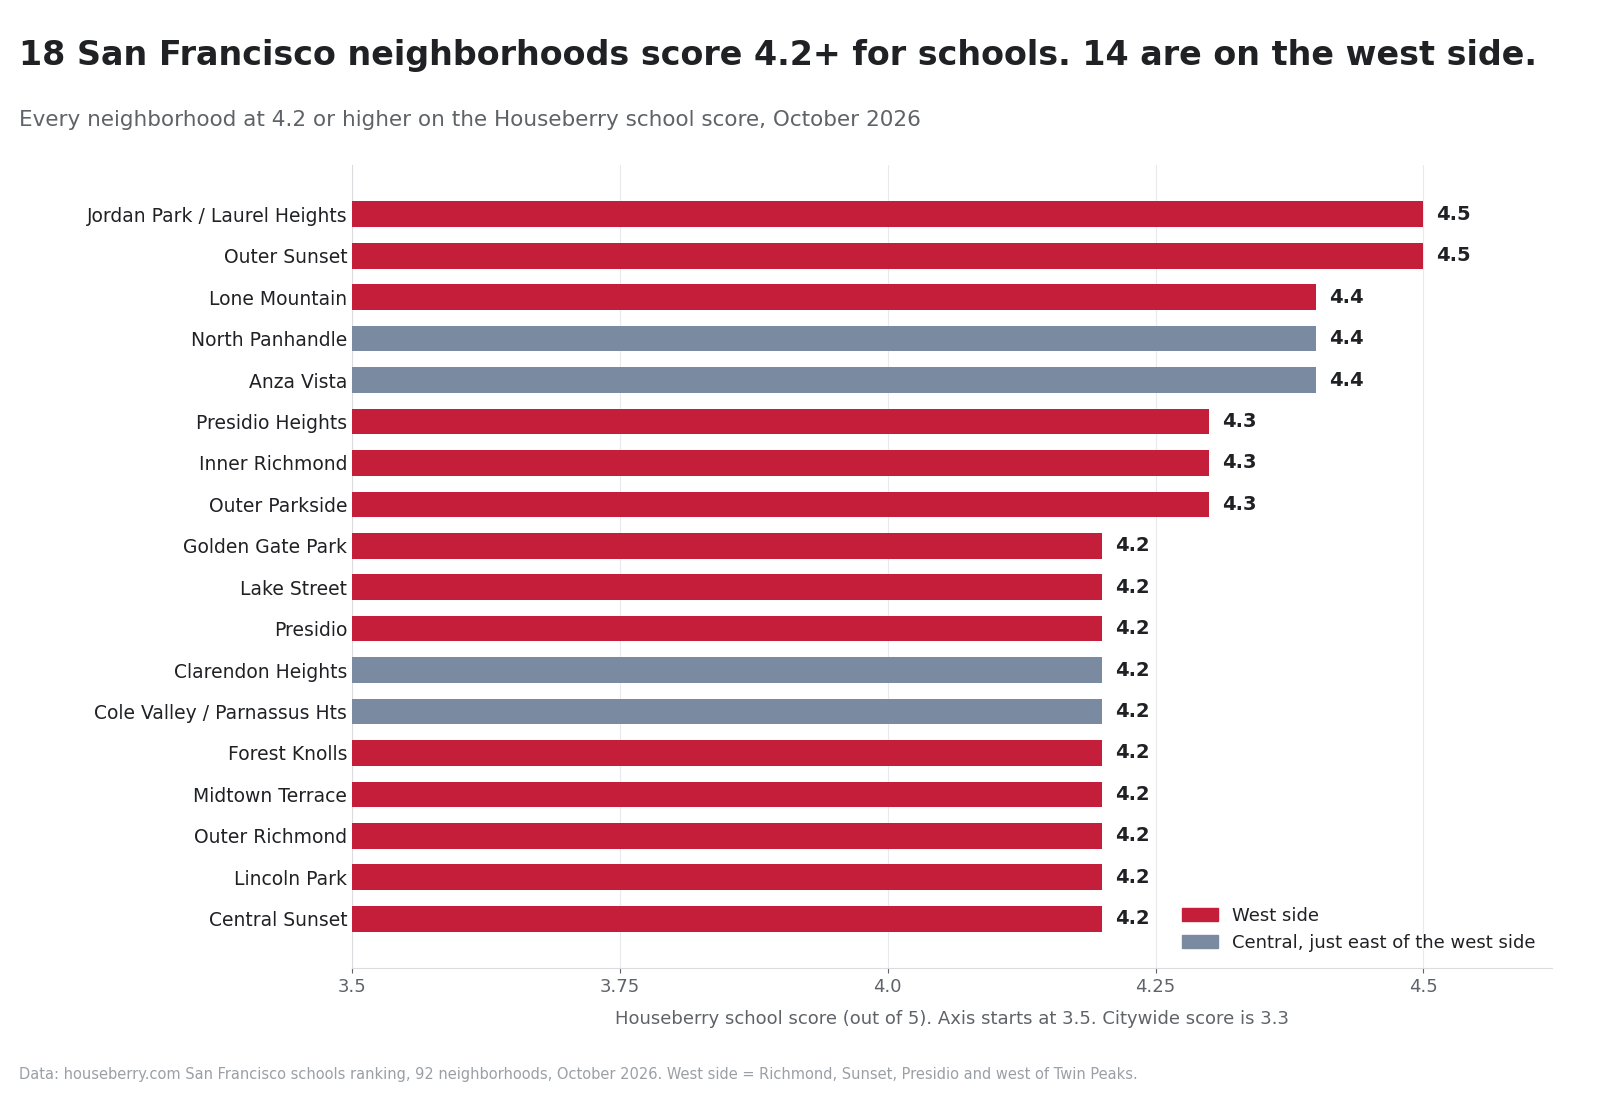
They cluster on the west side. Of the 92 San Francisco neighborhoods on our best-schools ranking, 18 score 4.2 or higher out of 5 as of October 2026, against a citywide school score of 3.3, and 14 of those 18 are in the Richmond, the Sunset, the Presidio or the neighborhoods west of Twin Peaks.
At the top, tied at 4.5, are Jordan Park / Laurel Heights, the pocket around Laurel Village just north of Geary, and the Outer Sunset, the fog-belt grid running out Judah and Noriega to Ocean Beach. The Outer Sunset page lists Sunset Elementary at 4.8 and Francis Scott Key and A.P. Giannini Middle at 4.3 each. The four exceptions are close in: North Panhandle, Anza Vista, Clarendon Heights and Cole Valley, all on the slopes and flats just east of the line.
Zoom out and the split gets starker. The typical west-side neighborhood scores 4.0 for schools. The typical neighborhood everywhere else scores 2.8. Twenty of the 24 neighborhoods at 4.0 or higher are west-side, and only one of the 32 neighborhoods below 3.0 is (Stonestown, at 2.4).
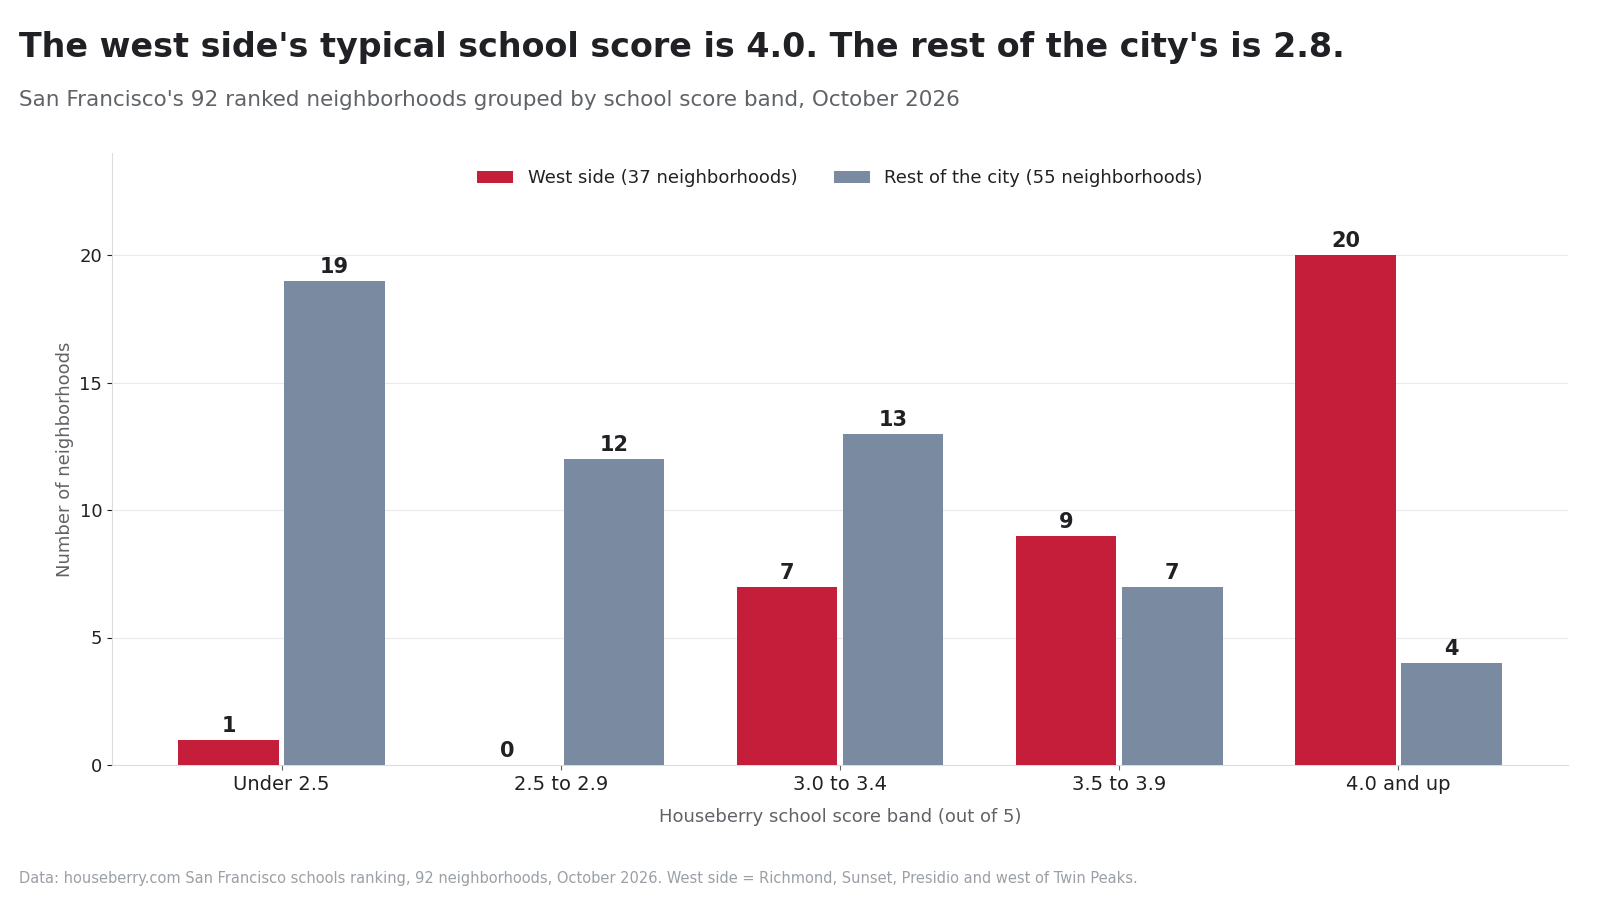
I would not read that as a verdict on any school, or on the kids in it. These scores track test results, and test results reflect a lot more than teaching, household income included. What they do tell you is where today's highest-scoring campuses are, which is exactly what a neighborhood guarantee would hand to the people who live closest.
What homes cost in the strongest school-score neighborhoods
Less than you would guess, at least in part of the map. San Francisco's citywide median was about $2.20 million in August 2026, per our San Francisco city page, and 8 of the 15 top-scoring neighborhoods with their own price history sit below it.
Here are those eight, cheapest first, using the latest month on each neighborhood page.
| Neighborhood | School score | Safety score | Median price (month) |
|---|---|---|---|
| Anza Vista | 4.4 | 3.3 | $1.25M (Sep 2026) |
| Outer Sunset | 4.5 | 4.3 | $1.69M (Sep 2026) |
| Outer Parkside | 4.3 | 4.5 | $1.74M (Jul 2026) |
| North Panhandle | 4.4 | 4.3 | $1.84M (Aug 2026) |
| Outer Richmond | 4.2 | 4.3 | $1.87M (Aug 2026) |
| Midtown Terrace | 4.2 | 4.7 | $1.92M (Sep 2026) |
| Central Sunset | 4.2 | 4.5 | $2.09M (Jul 2026) |
| Forest Knolls | 4.2 | 4.7 | $2.10M (Jul 2026) |
The cheapest 4.2-plus neighborhood is Anza Vista, the small hill east of Masonic around the old City Center site, at about $1.25 million in September 2026. Its honest trade-off is the safety score, 3.3, the lowest in the table. The Outer Parkside, off Taraval near Ocean Beach, and Midtown Terrace, the curving streets off Clarendon Avenue below Sutro Tower, pair 4.2-plus school scores with safety scores of 4.5 and 4.7.
Want to compare how all 92 neighborhoods line up on schools, safety and amenities at once? See the full San Francisco neighborhood ranking, then sort by the factor you care about most.
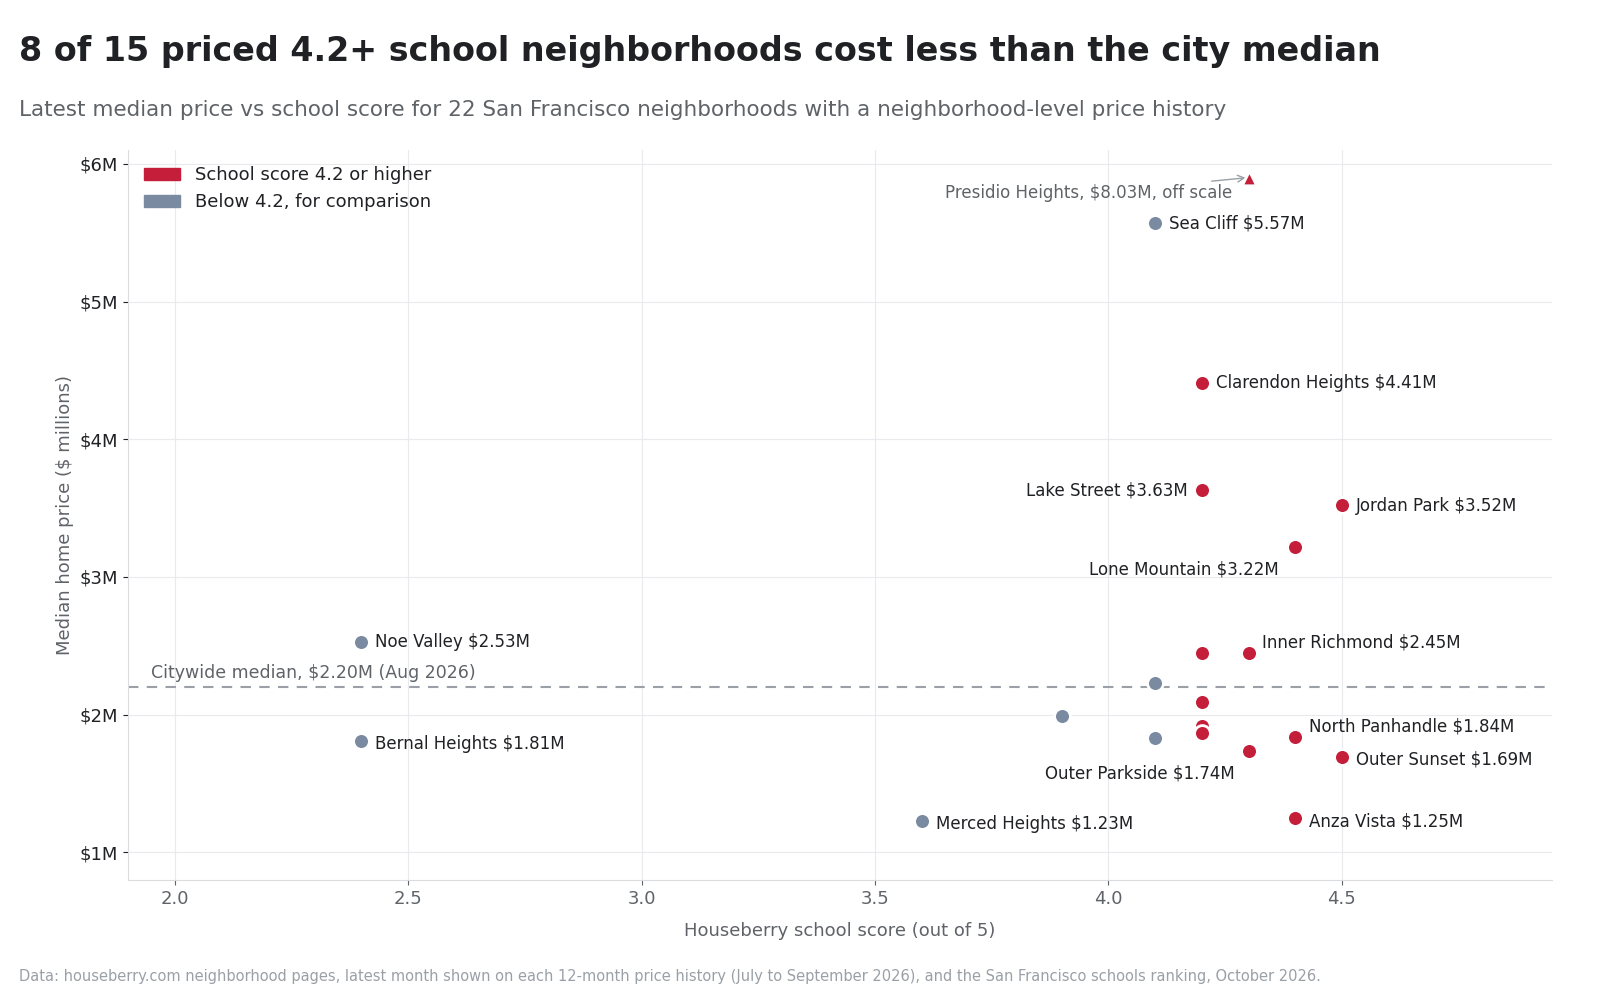
The comparison that sticks with me is Noe Valley. Its median was about $2.53 million in August 2026 with a school score of 2.4. The Outer Sunset costs about $840,000 less and scores 2.1 points higher. Divide price by school score and Noe works out to roughly $1.05 million per point, against about $376,000 in the Outer Sunset and $284,000 in Anza Vista. People pay for Noe's 24th Street, its sun and its commute down 280, and under a lottery the school score barely entered the math. A neighborhood guarantee would put it back in.
The top end tells the same story from the other side. Jordan Park / Laurel Heights, at about $3.52 million in July 2026, was about $2.59 million in August 2025. Presidio Heights, at 4.3, ran about $8.03 million in August, on thin sales that swing month to month. Those blocks were never priced on schools first. As we found in our analysis of how school scores move Bay Area home values, the relationship is real but uneven, and it is weakest exactly where a lottery cuts the cord between house and classroom.
Why the school-score map may not carry over into zones
The biggest reason is that no lines exist. Under a small-zones model, an Outer Sunset address might share a zone with schools in the Central Sunset or Parkside, which would blur any one neighborhood's edge. Under either neighborhood-guarantee model, the guaranteed school depends on attendance boundaries the district has not proposed, and citywide programs, such as Mandarin and Spanish immersion, would still draw from everywhere.
Then there is what the score measures. Our school score is built from California's CAASPP state test results at the public schools serving each area, which is a snapshot of where students test today. It is not a promise about a building in 2028, and a guarantee could shift who enrolls where. Some of the strongest-scoring schools have long waitlists precisely because families from across the city chose them. If those seats go to neighbors first, demand and results could rearrange in ways nobody can model yet.
And the district can still change course. The board can revise the direction in the spring. KTAP's poll shows magnets as popular as zones. And students already enrolled will not be moved, per the district's reorganization page, so the change reaches families entering TK, kindergarten or SFUSD for the first time.
So I would not buy a house on the October 13 vote. I would ask, of any west-side listing, which elementary school is closest, how full it is, and whether it feeds Giannini, Presidio or Roosevelt Middle, because those feeder patterns are already where geography counts.
The housing math underneath the school map
If school seats follow addresses, the number of addresses on the west side becomes a schools question. San Francisco Planning says only 10 percent of new housing over the past 15 years was built in the western and northern neighborhoods, even though they cover more than half the city's land. Those are the same neighborhoods holding 14 of the 18 strongest school scores.
The Family Zoning Plan, signed December 12, 2025 and in effect since January 12, 2026, allows mid-rise buildings on corridors like Geary, Judah, Taraval and Noriega. That is the quiet link between school board politics and a fair outcome. A neighborhood guarantee in a part of the city that barely builds turns a good school score into a scarce, expensive ticket. More homes near those campuses spreads the ticket around, and it keeps the enrollment that keeps a school open.
How we read the school data
Every score here comes from Houseberry's San Francisco best-schools ranking, which rates 92 neighborhoods on a 0 to 5 scale from state test results at the schools serving each one, as displayed on October 1, 2026. A few neighborhood pages show a slightly refreshed figure (Merced Heights reads 3.9 on its page versus 3.6 on the ranking), so treat tenths as approximate. Prices are the latest month on each neighborhood's 12-month history, July to September 2026. The west side means the Richmond, Sunset, Presidio and west of Twin Peaks, 37 neighborhoods in all. Neighborhoods without their own price history were left out of price comparisons.
The useful move this fall is to stop treating the school score as background and put it next to price, safety and commute for every block you are considering. Open the San Francisco school-score ranking, pick the five neighborhoods you would actually live in, and see what the October 13 vote could mean for each of them.
Sources
Hoodline, KTAP pushes SFUSD to overhaul school lottery system, October 1, 2026
SFUSD, School Reorganization, updated September 21, 2026
SFUSD, Board meeting calendar and agendas
San Francisco Parent Coalition, SFUSD Board Meeting Summary, September 1, 2026
The San Francisco Standard, SFUSD's enrollment overhaul is years behind schedule, May 18, 2026
The San Francisco Standard, SFUSD's school lottery is broken, August 18, 2026
KQED, As SFUSD welcomes back students, officials plan to revamp enrollment, August 17, 2026
San Francisco Planning, Family Zoning Plan
The Houseberry Research Team is Houseberry's reporting team: Bay Area real estate analysts, data specialists and longtime local market watchers. Every day we check the public record: building permits, city council and planning agendas, county recorder filings, state housing bills, police incident data and school results. Then we tie each story to what it means for specific neighborhoods, using Houseberry's own neighborhood data on prices, appreciation, safety, schools and amenities. Questions or corrections: Contact us.
Map of San Francisco Neighborhoods
Loading map...
View Full Map
Top Neighborhoods in San Francisco, CA


All information provided on this website including but not limited to - school ratings, safety, amenities, user opinions, and property data - is for general informational purposes only. We do not guarantee its reliability, accuracy, or completeness. Users should independently verify information and consult appropriate professionals as needed. By using this website, you agree Houseberry is not responsible for actions, decisions, or consequences arising from reliance on the information provided
houseberry.com - CA DRE# 01847391
 Bay East ©2025. CCAR ©2025. bridgeMLS ©2025. Information Deemed Reliable But Not Guaranteed. This information is being provided by the Bay East MLS, or CCAR MLS, or bridgeMLS. The listings presented here may or may not be listed by the Broker/Agent operating this website. This information is intended for the personal use of consumers and may not be used for any purpose other than to identify prospective properties consumers may be interested in purchasing. Data last updated at October 2, 2026 12:00 AM