California Exodus 2026: What the U-Haul Data Really Says
U-Haul ranks California second in the country for Gen Z arrivals and dead last overall. Both are true. What the state's own numbers say, and where a young mover can actually afford to land in the Bay Area.

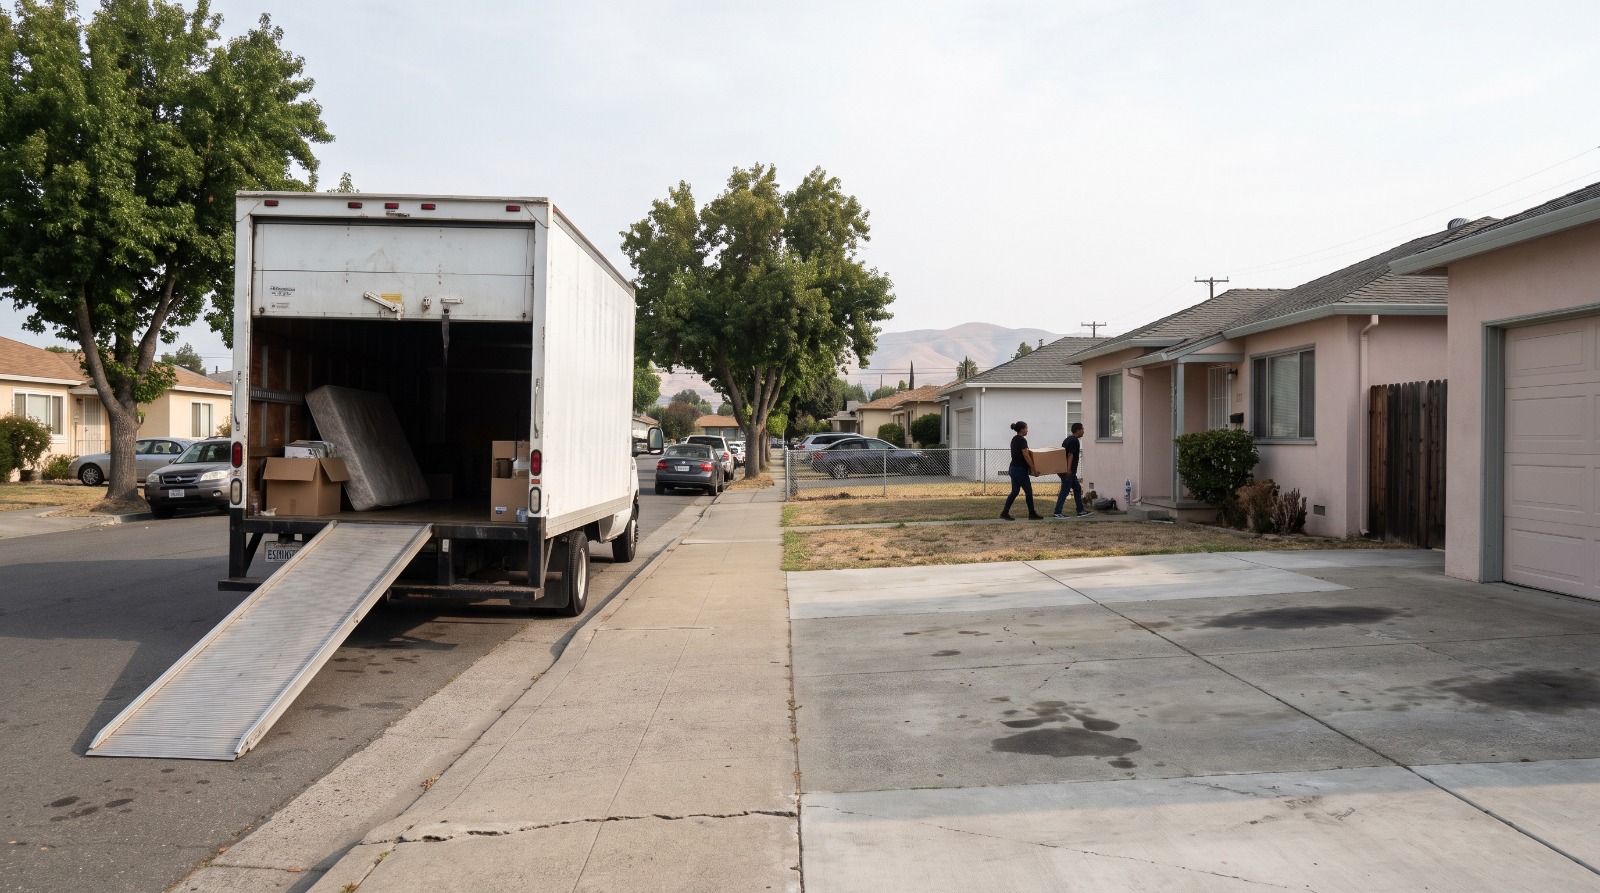
A rented moving truck parked outside postwar bungalows on a San Leandro street, one of the more affordable places young Bay Area movers land. Photo: Houseberry
U-Haul's midyear report ranks California the second-best state in the country for net Gen Z arrivals. The same company, eight months earlier, ranked California 50th out of 50 for the sixth year in a row. Neither number is wrong. They are measuring different things, and the space between them is where the actual story about who is moving to the Bay Area lives.
The short answer: young people really are a bigger share of the people moving in, California is still losing more residents to other states than it gains, and the one Bay Area place where the turn shows up in hard numbers is San Francisco, whose median sale price climbed 16.8 percent in twelve months.
What U-Haul actually counted
U-Haul counts one-way equipment transactions. A truck, trailer or box rented in one state and dropped off in another. Net arrivals minus net departures, sorted by the renter's generation, across roughly 2.5 million one-way transactions a year. The midyear report covers July 2025 through June 2026.
It is an ordinal ranking and nothing else. U-Haul publishes no magnitudes, so there is no way to say how many Gen Z movers California netted, only that it netted more than 48 other states. The company's own disclaimer says the rankings may not correlate directly to population or economic growth. That sentence is doing a lot of quiet work and almost nobody quotes it.
Why a truck company is the wrong instrument for this particular claim
The standard critique of moving-company migration data, written by economist Lyman Stone in 2016 and still the one everyone cites, is that it undercounts the young. Movers, he wrote, "tend to be young, lower-income, renters," and a full-service van line does not serve those people. So van-line data skews old and rich.
Run that argument on U-Haul and it flips, and the flip is the problem. A do-it-yourself box truck is what you rent when you are 24 and cannot afford movers. U-Haul structurally over-samples exactly the cohort this story is about. Which makes it the weakest available evidence for a claim about the age composition of movers, not the strongest. If Gen Z shows up disproportionately in truck-rental data, that may be telling you about who rents trucks.
There is a second blind spot. California Policy Lab found that of every 20 Bay Area residents who move, 11 stay inside their own county and only 3 leave the state. Interstate one-way rentals cannot see the 11. And truck availability itself moves the number, because one-way pricing is set partly by where U-Haul needs its fleet repositioned.
What California's own numbers say
The Department of Finance put California at 39,593,000 people as of January 1, 2026, down 54,000 from a year earlier. The composition matters more than the total: net domestic out-migration of 288,600, net international migration of 126,400, and a natural increase of 108,200. DOF's own read is that without the federal restrictions on legal immigration the state would have grown by about 66,000. The decline is an immigration story, not an exodus story.
At the county level, every core Bay Area county was still losing residents to the rest of the country as of DOF's July 2025 component estimates.
| Bay Area county | Net domestic migration, year to July 2025 | Population change, year to Jan 2026 |
|---|---|---|
| San Francisco | -2,061 | +0.1 percent, to 845,658 |
| Santa Clara | -13,009 | +0.2 percent, to 1,932,468 |
| Alameda | -12,308 | -0.1 percent, to 1,666,136 |
| San Mateo | -3,721 | flat, at 748,182 |
| Contra Costa | -7,940 | -0.3 percent, to 1,163,891 |
Only San Francisco and Santa Clara grew, and both grew only because births and international arrivals outran domestic losses. San Francisco's domestic loss of 2,061 is also the smallest in the region by a wide margin, at roughly a sixth of Alameda County's on a population barely half the size. That is the signal.
San Francisco is where the turn shows up in prices
California Policy Lab's July 2026 Bay Area report found that San Francisco has had more arrivals than departures since the middle of 2024. Prices agree. San Francisco's median sale price ran from $1.85 million in August 2025 to $2.16 million in July 2026, a 16.8 percent climb and the steepest twelve-month move of any Bay Area city we track.
Nothing else in the region did that. Oakland's median was $974,220 in July 2026, essentially flat against $977,450 a year earlier, after bottoming at $785,180 in March. San Jose went from $1.65 million to $1.63 million. So the recovery is not regional. It is one city, and mostly it is the city with the AI hiring.
Which produces the awkward part. If young movers are returning and they are concentrating in San Francisco, they are arriving into the most expensive housing market in the country at the moment it is reaccelerating. A market that goes up 16.8 percent in a year is not a market welcoming first-time buyers.
Where a young mover can actually land
This is the question the migration coverage never gets to. If you are 28, you have a Bay Area offer, and you would rather buy than rent into a market at $6,000 for a two-bedroom, what can you actually reach? The honest answer sits in a narrow band in southern Alameda County.
| Neighborhood | Overall score | Safety score | Median price, July 2026 |
|---|---|---|---|
| Cherryland, Hayward | 3.3 of 5 | 4.4 of 5 | $792,360 |
| Washington Manor, San Leandro | 3.4 of 5 | 3.7 of 5 | $850,480 |
| Bonaire, San Leandro | 3.7 of 5 | 4.9 of 5 | $858,560 |
| Marina Faire, San Leandro | 3.5 of 5 | 4.5 of 5 | $904,930 |
| Fairway Park, Hayward | 3.5 of 5 | 4.6 of 5 | $976,630 |
Read the first and third rows together. Bonaire in San Leandro scores 3.7 out of 5 overall with a 4.9 on safety at a median of $858,560, which beats Oakland's citywide score of 2.6 by more than a full point while costing $116,000 less than Oakland's citywide median. That is not a marginal difference. It is the single best score-to-price trade in the East Bay right now, and it is available because San Leandro is unfashionable rather than because anything is wrong with it.
The floor under this band is real and worth naming. Go below roughly $790,000 in the East Bay and the quality scores fall off hard, into the 1.4 to 2.6 range in deep East Oakland. Between about $790,000 and $980,000 you can still get a neighborhood scoring 3.3 or better with strong safety numbers. Below it, mostly you cannot. If price is the constraint, the best-value ranking for the East Bay is the more useful list to work from than the cheapest one.
What this does and does not mean
It does mean the composition of California migration has genuinely shifted by age. Boomers and Gen X are leaving in numbers that put four southeastern states at the top of U-Haul's list, and younger movers are not. It means San Francisco specifically has turned, and its prices confirm it independently.
It does not mean the exodus is over. The 18-to-25 departure rate is climbing, not falling. It does not mean young people are winning the affordability fight, because Policy Lab found that Bay Area residents who leave the state land in neighborhoods where median home values are $687,000 lower and are 48 percent more likely to own a home after seven years. People who leave are, on the whole, doing fine. And it does not mean a U-Haul ranking should ever be the load-bearing number in a housing decision.
Softening is the right verb. Reversing is not.
The follow-up questions
Is the California exodus over in 2026?
No, but it has slowed. California lost 288,600 residents on net to other states in the year to January 2026, well below the 2021 and 2022 peaks. The state's overall population fell 54,000, and the Department of Finance attributes that to reduced legal immigration rather than to more people leaving.
Is San Francisco growing again?
Yes, barely, and it is the only Bay Area county besides Santa Clara that grew in the year to January 2026, up 0.1 percent to 845,658. California Policy Lab found more arrivals than departures in the city since mid-2024, and the median sale price rose 16.8 percent over the twelve months to July 2026.
How accurate is U-Haul migration data?
It is a real dataset and a poor population estimate. It counts one-way rental transactions rather than people, publishes ranks rather than magnitudes, misses every in-state move, and over-represents younger, lower-income, do-it-yourself movers. U-Haul itself says the rankings may not correlate directly to population growth. Treat it as corroboration, never as the primary source.
Where do people who leave the Bay Area actually go?
Mostly not far. California Policy Lab found that 11 of every 20 Bay Area movers stay in their own county and only 3 leave California. Those who do leave the state land where median home values are about $687,000 lower, take incomes roughly 8 percent lower, and end up more likely to own.
The practical version
If you are moving to the Bay Area this year, the migration headlines do not change what you should do. They just remove one excuse for delay, because the market you are entering has more competition in it than it did in 2023. Our data-driven guide to moving to the Bay Area covers the mechanics, and if the budget is the binding constraint, start instead with the cheapest Bay Area places that still score well on safety. Pick the neighborhood before the listing. A U-Haul ranking cannot tell you whether you will want to stay, and staying is the part that decides whether the move worked.
Sources
U-Haul, 2026 Midyear Migration Trends national report, July 29, 2026
U-Haul Growth Index for 2025, January 2026
The Registry, U-Haul midyear data and the Bay Area, August 26, 2026
California Department of Finance, E-1 population estimates, May 1, 2026
California Department of Finance, county components of change, February 2026
California Policy Lab, Priced Out of the Bay, July 30, 2026
UC Berkeley News on the California Policy Lab study, March 31, 2026
Lyman Stone, Are Van Rentals a Good Proxy for Migration, 2016
Houseberry, San Francisco city price history, July 2026
The Houseberry Research Team is Houseberry's reporting team: Bay Area real estate analysts, data specialists and longtime local market watchers. Every day we check the public record: building permits, city council and planning agendas, county recorder filings, state housing bills, police incident data and school results. Then we tie each story to what it means for specific neighborhoods, using Houseberry's own neighborhood data on prices, appreciation, safety, schools and amenities. Questions or corrections: Contact us.
All information provided on this website including but not limited to - school ratings, safety, amenities, user opinions, and property data - is for general informational purposes only. We do not guarantee its reliability, accuracy, or completeness. Users should independently verify information and consult appropriate professionals as needed. By using this website, you agree Houseberry is not responsible for actions, decisions, or consequences arising from reliance on the information provided
houseberry.com - CA DRE# 01847391
 Bay East ©2025. CCAR ©2025. bridgeMLS ©2025. Information Deemed Reliable But Not Guaranteed. This information is being provided by the Bay East MLS, or CCAR MLS, or bridgeMLS. The listings presented here may or may not be listed by the Broker/Agent operating this website. This information is intended for the personal use of consumers and may not be used for any purpose other than to identify prospective properties consumers may be interested in purchasing. Data last updated at October 22, 2026 12:00 AM