Bay Area King Tides 2026: Kelvin Wave Dates and Neighborhoods
A Kelvin wave could lift the Bay 6 to 12 inches this fall. Here are the 2026-27 king tide dates, NOAA's predicted heights, and the shoreline neighborhoods that feel it first.
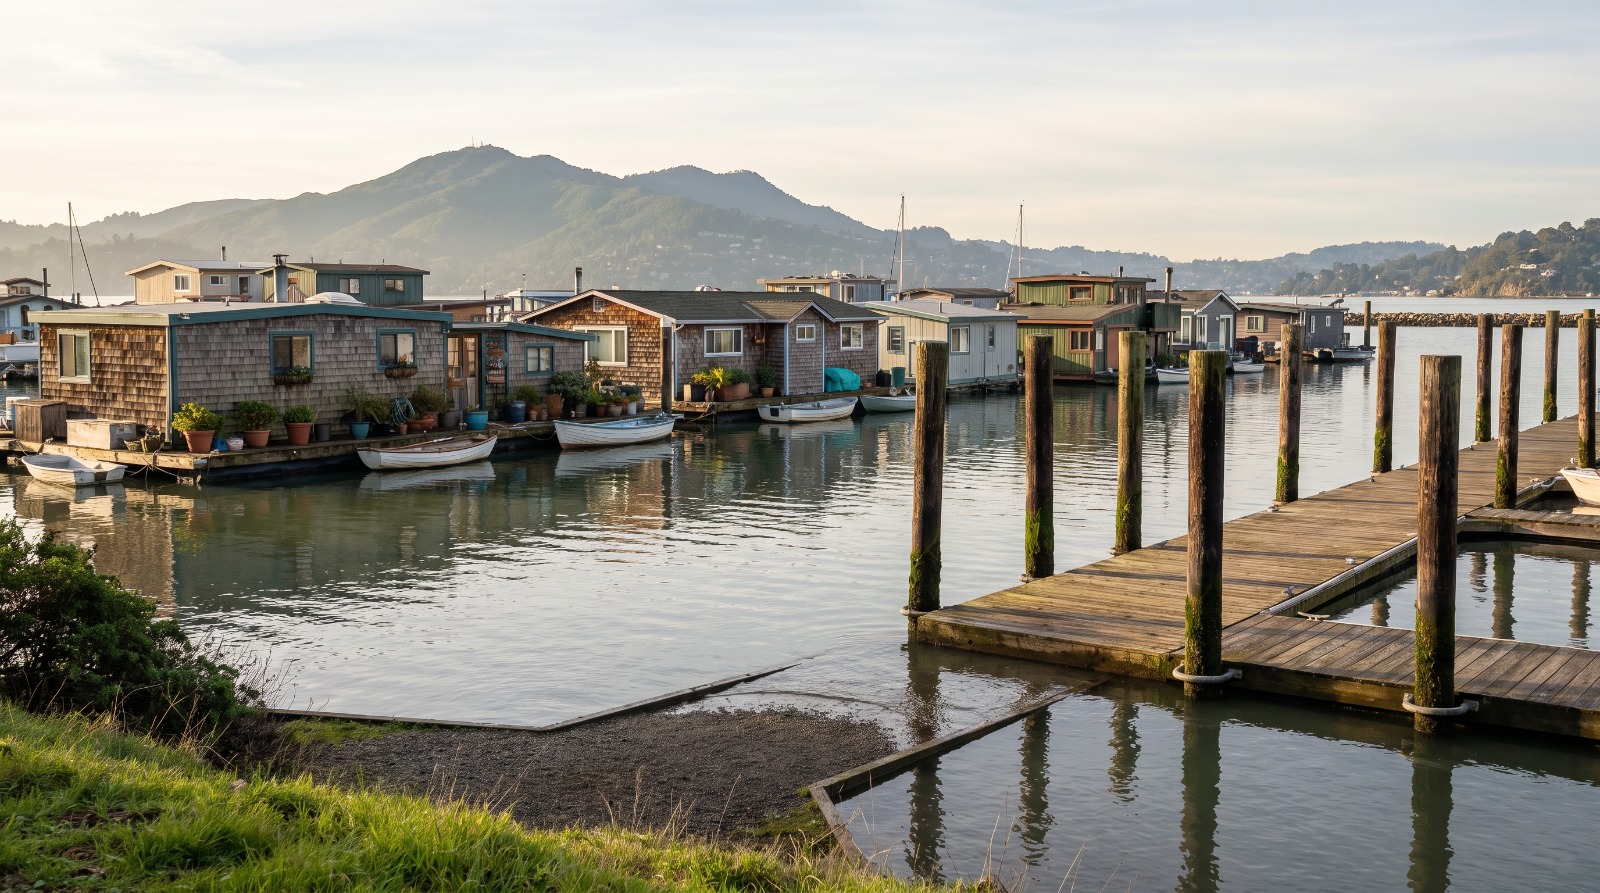
Sausalito floating homes at Waldo Point Harbor riding a high Bay Area king tide below Mount Tamalpais Photo: Houseberry
On January 2, business owners along Gate 5 Road in Sausalito told NBC Bay Area the water was the worst they had seen in more than 20 years. That was a normal king tide season with a storm on top. This fall the Bay starts a step higher.
A Kelvin wave, the slow bulge of warm ocean that El Niño pushes up the coast, could raise Bay Area sea levels by 6 to 12 inches starting in October, according to NC State marine scientist Dillon Amaya in ABC7's September 18 report. October's own tides are modest, so the real test is when that extra water lines up with the Bay Area king tides on November 24 to 26, December 23 to 25 and January 21 to 22. The blocks that feel it first are the ones that already get wet on an ordinary king tide.
What a Kelvin wave actually does to the Bay
A Kelvin wave is not something you would see from the beach. Amaya describes it to ABC7 as "a bulging of the nearest 20 to 30 kilometers of the ocean" that travels up the coastline, which means it raises the baseline for weeks and every high tide rides on top of it.
KION and CBS put the first wave here in the first or second week of October. They also note that September and October tides are among the year's lowest, so the October bump alone is unlikely to set records. The worry is later waves.
And the water is already running high. A National Weather Service coastal flood advisory covered San Francisco, San Pablo and Monterey Bays from September 28 to October 1, with tides forecast to about 7.03 feet and no storm in sight, per Hoodline. On the Peninsula, forecasters said tides were running about a foot above normal and could spill onto trails at Redwood Shores, Bair Island and the Palo Alto Baylands, The Almanac reported.
This is the next chapter of our August piece on checking flood risk before a super El Niño winter, which covered rain and buyer homework. This one is about tides, dates and specific shorelines.
The king tide dates, with NOAA's predicted heights
The California Coastal Commission lists this season's statewide king tides as November 24 to 26, December 23 to 25, and January 21 to 22, with some Northern California spots also peaking December 22 and January 20 or 23 (Coastal Commission). Here is what NOAA's tide tables predict for two Bay stations, San Francisco at the Golden Gate and Alameda.
| Window | San Francisco peak (predicted) | Alameda peak (predicted) |
|---|---|---|
| Late October preview | 6.67 ft, Oct 28, 12:56 p.m. | 7.44 ft, Oct 28, 1:27 p.m. |
| Nov 24 to 26 | 7.03 ft, Nov 25, 10:49 a.m. | 7.77 ft, Nov 25, 11:21 a.m. |
| Dec 23 to 25 | 7.23 ft, Dec 24, 10:37 a.m. | 7.93 ft, Dec 24, 11:09 a.m. |
| Jan 21 to 22 | 7.11 ft, Jan 21, 9:39 a.m. | 7.80 ft, Jan 21, 10:11 a.m. |
Heights are feet above each station's mean lower low water, so compare down a column, not across. Alameda reads higher because the tide range grows toward the south Bay. And every peak lands in daylight, which makes them easy to go look at.
The late October row is the sleeper. If the first Kelvin wave delivers its full foot during the October 26 to 29 high tides, simple addition puts San Francisco near 7.67 feet, higher than a normal Christmas king tide. That is an if, not a forecast.
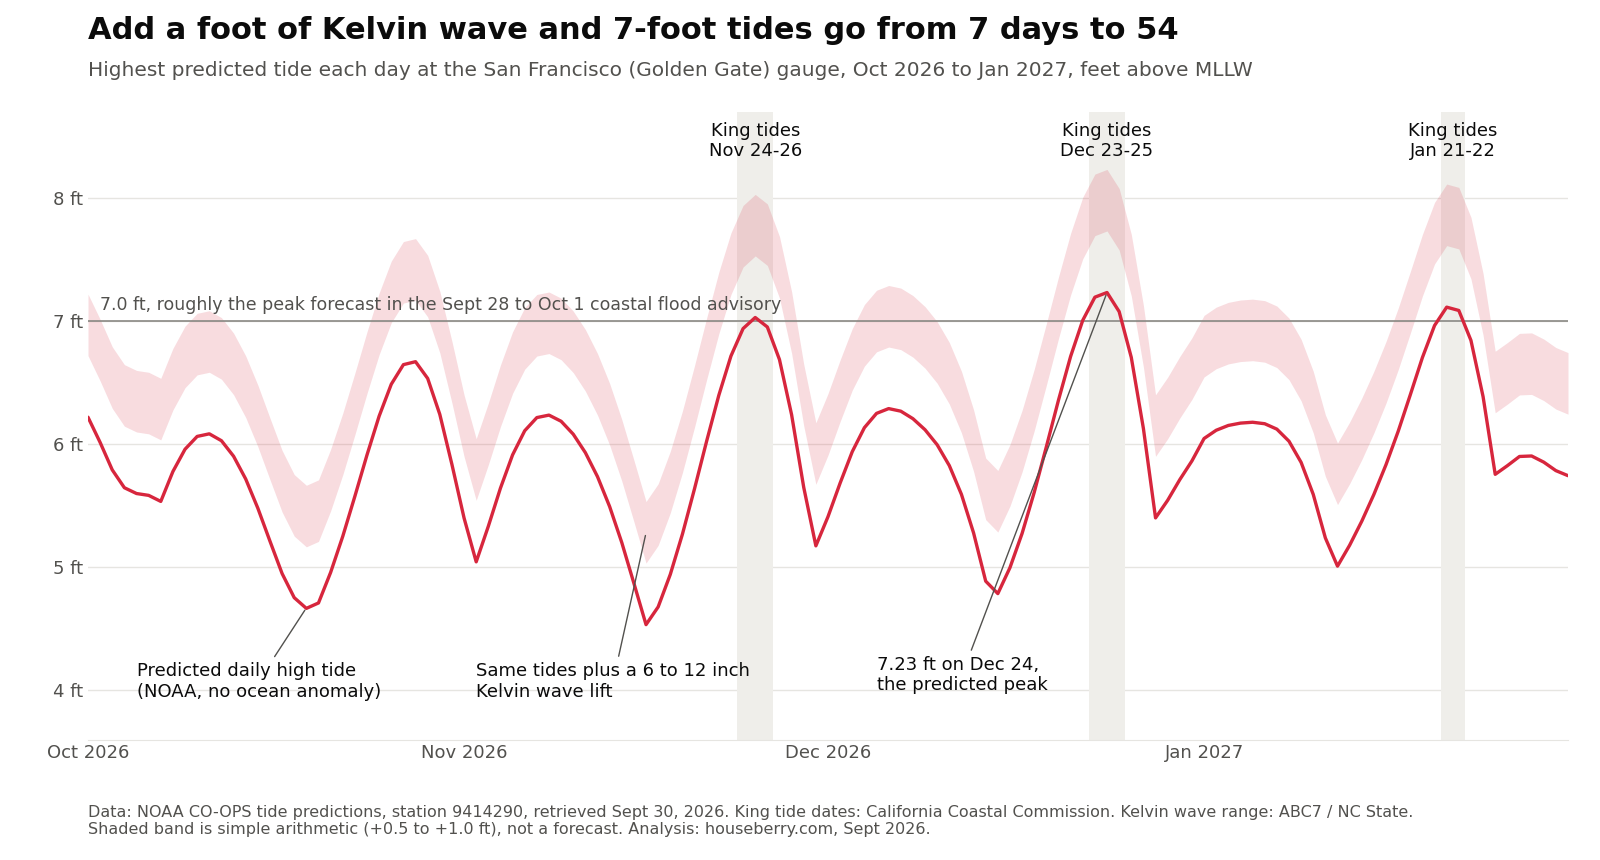
We ran that count ourselves from NOAA's predictions. The lift will not be a flat foot all winter, so read the band as a what-if range. But it is why the whole season matters, not just three marked mornings.
Which shoreline neighborhoods feel it first
The short answer is the places that already flood on a regular king tide. Nothing below is a new exposure rating. It is where agencies and local reporting already show tidal water reaching streets, lots and shorelines.
Southern Marin
Tam Junction, the Mill Valley crossroads where Shoreline Highway meets Almonte Boulevard, sits just up the road from the Manzanita Park and Ride, the lot Caltrans partly closes when high tides are projected. Hoodline put the closure threshold at about 6.2 feet. Caltrans' US-101 and Highway 1 sea-level rise project covers the corridor from Marin City near Donahue Street to the Richardson Bay Bridge, but its draft environmental document is not due until summer 2027. This winter, the fix is still sandbags and tide gates.
In Sausalito, the Marinship waterfront holds the floating homes at Waldo Point Harbor and the Gate 5 Road businesses that flooded in January. The City Council has authorized $250,000 for El Niño work, including raising the road near Varda Landing before the king tides, ABC7 reported. Marinship's median sale price was about $1.01 million in August 2026 in our data, with a 4.1 overall score. That is the honest picture: a well-liked neighborhood with a known low spot and a city spending on it.
Alameda
Bay Farm Island is Alameda's top-ranked neighborhood in our data, with a 4.6 overall score, 4.9 for safety, and a median of about $1.38 million in July 2026. It is also where the City Council voted on April 7 to move shoreline adaptation to 60 percent design with a $2.64 million state grant, including an interim raise of Island Drive, the Alameda Post reported. Construction is tentatively aimed at around 2030.
On the main island, January's king tides pushed waves over the dunes onto Shore Line Drive, and USGS researcher Patrick Barnard told KQED that about 60 percent of Alameda's groundwater already sits close to the surface.
San Francisco's east waterfront
Mission Bay is the newer neighborhood wrapped around Mission Creek and the UCSF Mission Bay campus, just south of Oracle Park. The Port of San Francisco says stormwater already floods the Mission Creek area, and its Mission Creek and Mission Bay resilience page points to the Waterfront Flood Study plan finalized in August 2026. Tidal water reached the Embarcadero as recently as June (ABC7). Mission Bay's median was about $1.5 million in August 2026, in our numbers.
The Peninsula bayfront
Redwood Shores was named in this week's advisory. It is also the top-ranked neighborhood in Redwood City in our data, with a 5.0 school score and a median near $2.38 million in July 2026. Next door, Foster City finished a $90 million, 6.5-mile levee raise in February 2024 (Foster City), which is exactly the kind of fact worth checking when you compare Foster City's neighborhoods. East Palo Alto's shoreline story is its own, and we covered it in our piece on Palo Alto's living levee and the SAFER Bay project.
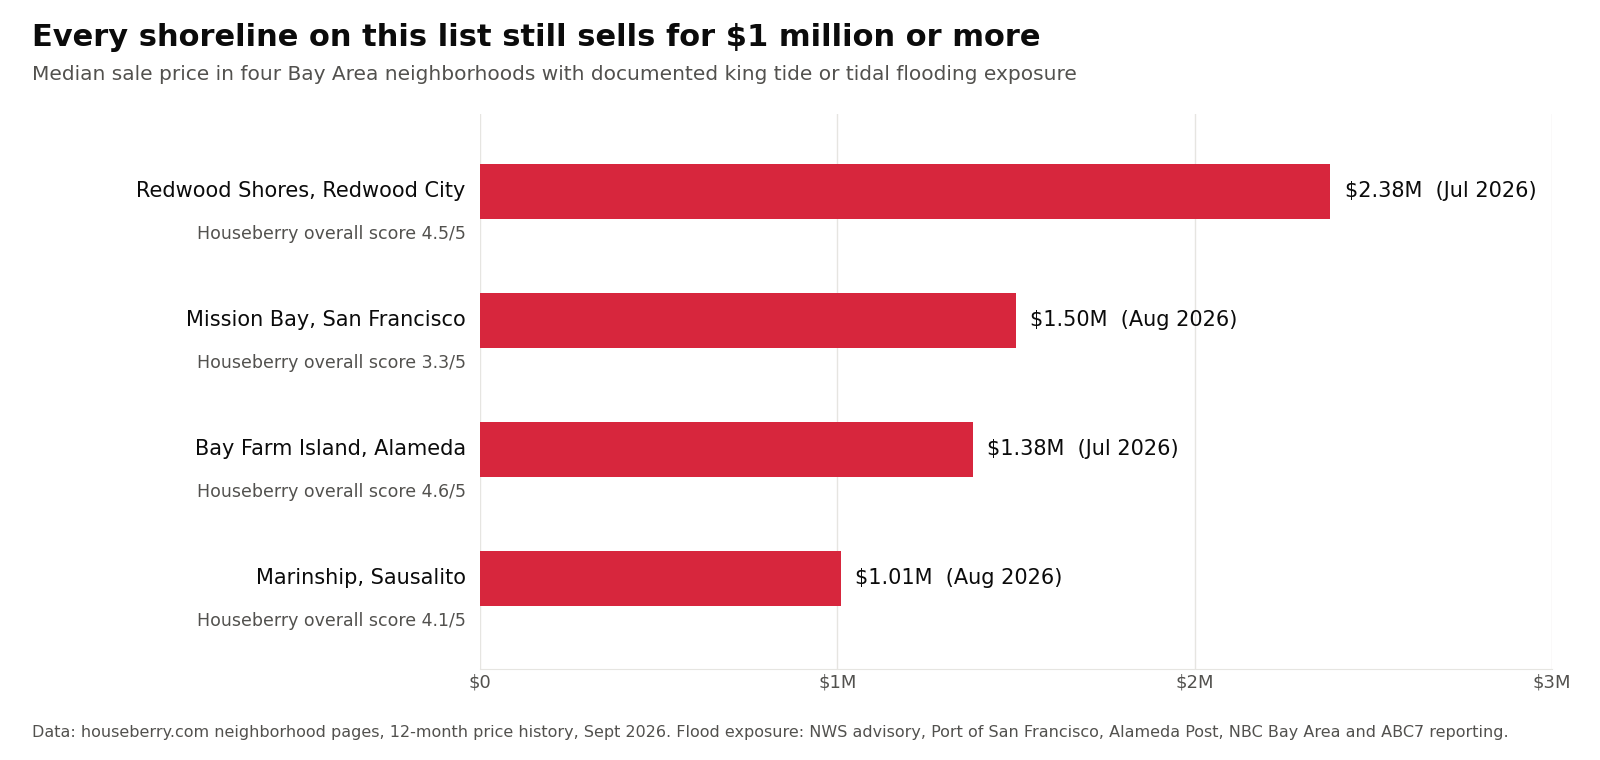
Those prices are why levee money matters. A rising Bay is also a good argument for adding homes on higher ground near transit, while funding the levees that protect the homes already here.
What the insurance warning means for owners and buyers
A standard homeowners policy typically will not pay for rising bay water. In a September 22 release, the California Department of Insurance said homeowners, renters and commercial policies typically exclude flooding, and that flood insurance through the National Flood Insurance Program generally takes effect 30 days after purchase, except when it is required as part of a home purchase (CDI).
That 30-day clock turns the tide table into a calendar. Coverage bought after about October 25 will not be active for the November king tides. Coverage bought after about November 23 misses the Christmas peak. If you are closing on a shoreline home, the lender-required policy is the exception, but the premium still belongs in your monthly math before you write the offer.
How to read your own block this season
Go look. Pick one of the king tide mornings in the table, stand at the lowest corner of the street at the listed time, and watch where the water goes. The California King Tides Project collects public photos from these mornings, and they are worth scrolling for your shoreline before you visit.
Notice the small tells while you are there: fresh sandbags by garages, flap gates on storm drains, a city notice on a pole. Ask a neighbor what January 2 looked like. Then ask the city who maintains the nearest levee or seawall, and what is funded.
The water this winter is a preview of what ordinary tides look like a few decades from now. The blocks that handle it well will show it in daylight on a weekday in December. If you are weighing a move to the water, we would start with the ranked neighborhoods on Houseberry's Marin page and then spend a king tide morning on the one street you actually care about.
Sources
- ABC7: El Niño-driven Kelvin wave could raise Bay Area sea levels by up to 1 foot in October (Sept 18, 2026)
- The Guardian: California rushes to prepare for massive Kelvin wave and predicted sea level rise (Sept 30, 2026)
- iHeart: Kelvin wave could lift California sea levels by a foot (Sept 28, 2026)
- KION: Bay Area sea levels expected to rise nearly 1 foot due to planetary wave (Sept 6, 2026)
- Hoodline: SF Bay coastal flood advisory (Sept 28, 2026)
- The Almanac: National Weather Service issues coastal flood advisory (Sept 28, 2026)
- California Coastal Commission: California King Tides Project dates
- NOAA tide predictions, San Francisco station 9414290
- NOAA tide predictions, Alameda station 9414750
- California Department of Insurance: Commissioner Lara urges Californians to review coverage (Sept 22, 2026)
- NBC Bay Area: King tides cause major flooding in Marin County (Jan 2, 2026)
- Caltrans: US-101, State Route 1 Sea-Level Rise Project
- Alameda Post: Council advances Bay Farm Island shoreline adaptation
- KQED: For this Bay Area island city, water is coming from all sides
- Port of San Francisco: Mission Creek / Mission Bay resilience
- Foster City: Levee Improvements Project completed
- Houseberry neighborhood data for Marinship, Bay Farm Island, Mission Bay and Redwood Shores, July and August 2026
Map of Marin Neighborhoods
Loading map...
View Full Map
Top Neighborhoods in Marin, CA



All information provided on this website including but not limited to - school ratings, safety, amenities, user opinions, and property data - is for general informational purposes only. We do not guarantee its reliability, accuracy, or completeness. Users should independently verify information and consult appropriate professionals as needed. By using this website, you agree Houseberry is not responsible for actions, decisions, or consequences arising from reliance on the information provided
houseberry.com - CA DRE# 01847391
 Bay East ©2025. CCAR ©2025. bridgeMLS ©2025. Information Deemed Reliable But Not Guaranteed. This information is being provided by the Bay East MLS, or CCAR MLS, or bridgeMLS. The listings presented here may or may not be listed by the Broker/Agent operating this website. This information is intended for the personal use of consumers and may not be used for any purpose other than to identify prospective properties consumers may be interested in purchasing. Data last updated at October 1, 2026 12:00 AM