SF Bike Ridership Is Up 35 Percent. Does That Match Yours?
SFMTA says average daily bike ridership rose 35 percent from March 2025 to March 2026. The number rests on twelve pavement sensors, four of them on the Wiggle, compared across a nearly rainless March. Here is what it can and cannot tell you.

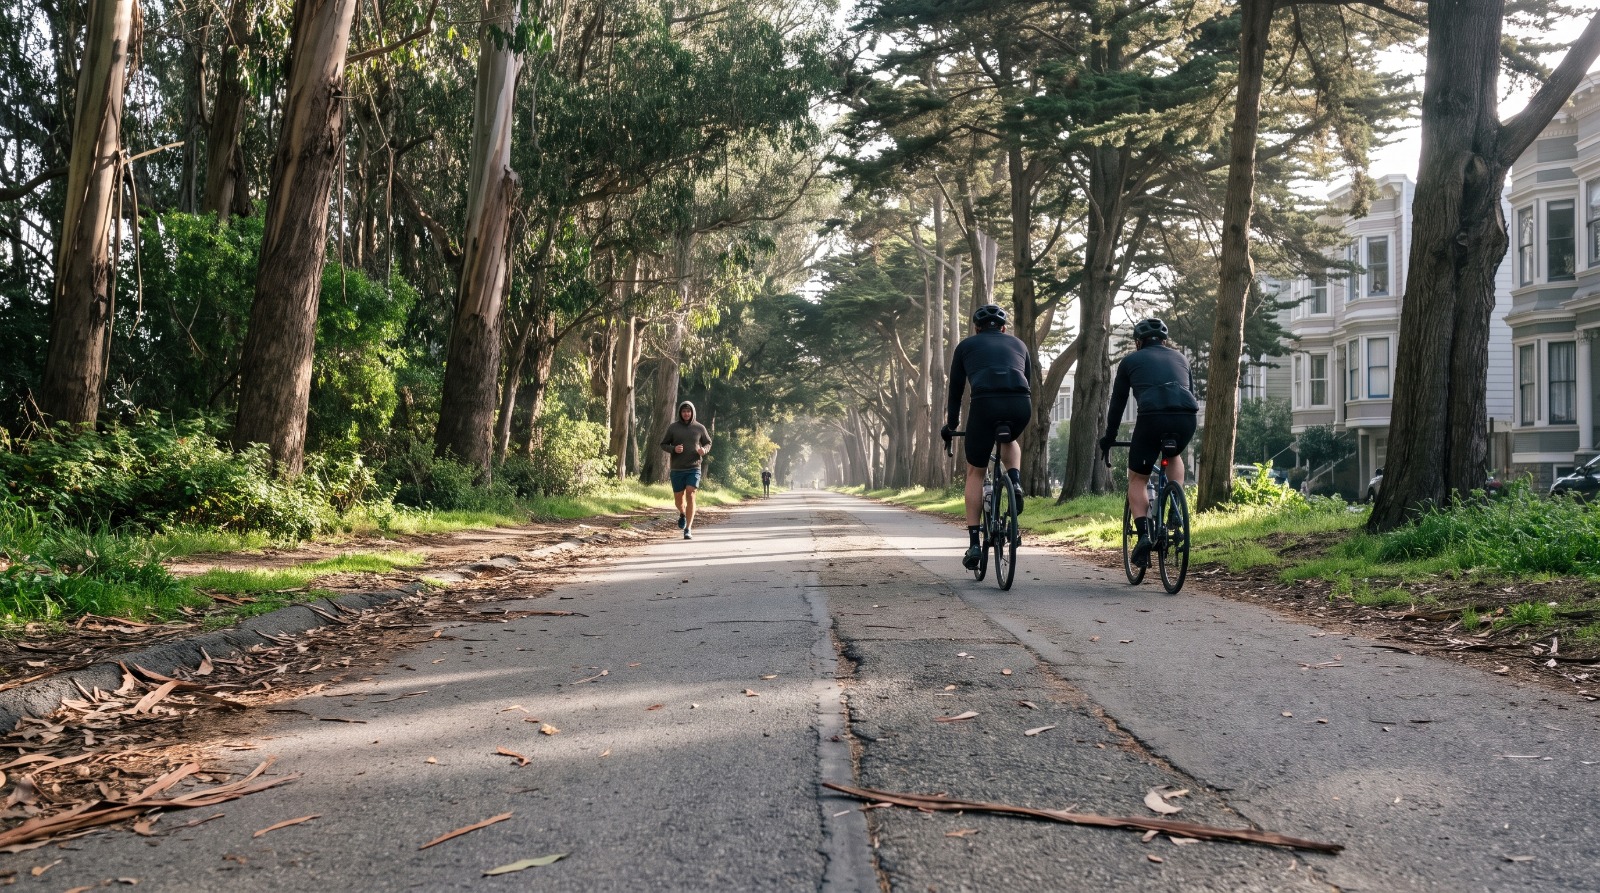
Cyclists on the eucalyptus-shaded Panhandle path in San Francisco, one of the corridors where SFMTA counts bike traffic. Photo: Houseberry
SFMTA told the SF Standard this month that average daily bike ridership in San Francisco rose 35 percent between March 2025 and March 2026. If you ride here, you probably had one of two reactions. Either yes, obviously, look at the Panhandle on a Tuesday morning. Or: 35 percent of what, exactly.
Both reactions are defensible, and here is why. The figure comes from twelve pavement sensors, four of which sit on a single mile of the Lower Haight. March 2026 recorded 0.15 inches of rain in San Francisco. March 2025 recorded 1.93. And two of those twelve sensors are on Valencia Street, which was an active construction zone in the baseline month.
The direction is almost certainly right. The size of it deserves an asterisk, and by the end of this I want to know whether it matches what you see on your own street.
Where the number comes from
SFMTA's public dashboard is built on what the agency describes as its twelve consistently reporting counters, using data from 2018 onward. These are inductive loops embedded in the pavement, inside a bike facility, counting all day.
Two honest caveats about the sourcing. The 35 percent figure does not appear on the SFMTA page the Standard links to, and that page was last modified in July 2025, eight months before the March 2026 data it would be describing. The agency has published no bicycle count report since 2022. So this is a number SFMTA gave a reporter, not a number anyone can look up and check, and it is worth saying that out loud rather than repeating it as documented fact.
Four of twelve counters are on the Wiggle
Here is the sample, grouped by corridor, from the city's own open data.
| Corridor | Counters | Neighborhood |
|---|---|---|
| Oak, Fell and Page, the Wiggle route | 4 | Hayes Valley and Haight Ashbury |
| Valencia Street | 2 | Mission |
| Market Street at 9th | 2 | SoMa and Tenderloin |
| Marina bike path | 1 | Marina |
| Indiana Street | 1 | Potrero Hill |
| Cabrillo Street | 1 | Inner Richmond |
| Golden Gate Avenue | 1 | Lone Mountain |
Eight of the twelve sit on four streets. That is not a citywide measurement. It is a measurement of four corridors, three of which run through the flattest, most bike-committed part of the city.
What is not measured is the more striking half. There is no counter on the Embarcadero. None on JFK Promenade. None on the Great Highway or in Sunset Dunes. None in the Sunset, Bernal Heights, Noe Valley, the Castro, Dogpatch, Mission Bay or Bayview. The two largest car-free facilities San Francisco has built this decade do not appear in the number at all.
That cuts both ways, which is the part I find interesting. A sample concentrated on the Wiggle will overstate a good year on the Wiggle. It will also completely miss the several thousand people a day now riding through a park that did not exist in 2024.
March 2026 was one of the driest on record. March 2025 was not
San Francisco recorded 0.15 inches of rain in March 2026 against 1.93 inches in March 2025, per Golden Gate Weather Services. That is close to a thirteenfold difference, and roughly a twentieth of a normal March.
SFMTA has itself attributed a 5 percent swing in its counts to wet conditions in a single wet stretch. Nobody has published a model that turns a thirteenfold rainfall difference into a percentage of the 35, but you do not need one to know it is a meaningful share of it.
Valencia was torn up during the baseline month
The second confound is more specific. SFMTA began construction on Valencia Street's replacement curbside bike lane on February 10, 2025, with a two to three month schedule. March 2025 sits squarely inside that window, and two of the twelve counters are on Valencia.
Valencia has been the most volatile bike count in the city for three years. Sensors recorded roughly 3,400 to 3,500 riders a day in the old door-zone lane, a drop to about 1,600 to 1,800 after the center-running lane opened in August 2023, and a recovery to more than 2,400 by that December. SFMTA's own read was that the center lane ended up about 3 percent above the original configuration. One street's construction cycle can move that count by half in either direction, and it is sitting inside a twelve-sensor average.
The counter network keeps shrinking
This is the quiet problem. San Francisco had 39 bike counters in 2019, 23 by the 2022 count report, and twelve on the current dashboard.
SFMTA published two different totals for the same year, 2019: 10.8 million bikes counted on 39 counters, and 5.33 million recomputed on 23. Same city, same year, factor of two apart, purely from how many sensors were in the network. That is the reason the agency compares counters to themselves rather than publishing totals, and it is also the reason nobody can draw an honest 2019 to 2026 trend line from public data.
What corroborates the direction
A separate dataset, and a much better one, points the same way. Bay Wheels riders took 4.4 million trips in 2025, up 31 percent year over year, which Lyft called one of the largest annual bikeshare gains in the country. Bikeshare counts every trip on the system rather than sampling twelve pavement loops, so it is not vulnerable to any of the problems above.
Electric bikes are doing much of the work. During Big Game week in February 2026, Bay Wheels logged more than 110,000 rides in San Francisco and e-bikes were 79 percent of them. Bike to Wherever Day participation was up about 40 percent in May 2026. Sunset Dunes, the 77-acre park that replaced the Upper Great Highway in April 2025, logged 1.7 million visits in its first year.
Add it up and the reasonable conclusion is that cycling in San Francisco really has grown substantially, that a good share of the growth is electric and recreational rather than commute, and that 35 percent is the high end of a plausible range rather than a measured fact.
The parts of the city that actually got more connected
Infrastructure, not counters, is what changes whether a neighborhood feels rideable, and the last four years have been eventful.
Voters kept JFK Promenade car-free in November 2022, passing Proposition J by 63.07 percent to 36.93 and rejecting Proposition I by a similar margin. Valencia's center-running lane was removed by a unanimous SFMTA board vote in November 2024 and reopened as a curbside protected lane in May 2025. Twenty Slow Streets corridors are now permanent, and SFMTA measured a 48 percent decline in collisions on them against a 14 percent citywide decline.
And the Great Highway is genuinely unsettled. Proposition K passed 55 to 45 citywide in November 2024, but 64 percent of Sunset voters opposed it. Supervisor Joel Engardio, who championed it, was recalled 62.9 to 37.2 in September 2025. Proposition G, which would reopen the roadway to cars on weekdays, is on the November 3, 2026 ballot, and the Controller has priced it at about 9.8 million dollars upfront plus 1.9 million a year. If you are weighing a Sunset house partly on that park, that vote is eight weeks out.
On safety, the record is better than most people assume and worse than the headline. San Francisco recorded 25 traffic deaths in 2025, down from 43 in 2024 and the lowest total since 2018, with zero cyclist fatalities so far in 2026. At the same time, injuries from powered stand-up devices in the city rose from 36 in 2018 to 315 in 2025, and 39 percent of hospitalized cyclist crashes never show up in police records at all. More riding, on faster machines, with an injury count that official statistics undercount.
Where this shows up in prices
This is the part we care about most, and it is more subtle than a bike score.
San Francisco's citywide median sale price was about 2.20 million dollars in August 2026. The flat, well-connected neighborhoods carry a premium that has more to do with topography and grid than with any single bike lane. North Panhandle, the neighborhood the Wiggle empties into, ran about 3.08 million in August 2026 with a 4.3 safety score and 4.4 on schools. Inner Mission, two Valencia counters away, was about 2.33 million in the same month. Dogpatch sat near 2.10 million.
The interesting one is Outer Sunset at about 1.70 million in July 2026, ranked second of the 92 San Francisco neighborhoods we score, with a 4.3 on public spaces. It is flat, it is a mile from a two-mile car-free park that did not exist two years ago, and it is roughly half a million dollars below the citywide median. It is also the neighborhood that voted hardest against the park and recalled its supervisor over it. Whichever way that resolves in November, the amenity arrived after the prices were set, which almost never happens in this city and is exactly the kind of thing worth watching in the amenity rankings.
So, does 35 percent match what you see?
I ride the Panhandle and Fell most weeks, and my honest impression is that there are noticeably more people on bikes than two years ago, that a large share of them are on e-bikes, and that on a dry Tuesday in March the Wiggle can feel like a different city than it did in 2023.
That impression is exactly as unscientific as a twelve-sensor average, which is sort of the point.
You know your own block better than any dashboard does. Is your street busier on two wheels than it was a year ago, or does it look the same and the growth is all somewhere else? Did the Valencia rebuild bring you back, or did you give up on it? Has anything actually changed on the flat side of town, or is this a story about weather? Tell us what you are seeing, because the counters clearly are not going to.
Sources
- SF Standard, September 4, 2026: the best bike shops in San Francisco, citing SFMTA ridership
- SFMTA average weekday bike volumes dashboard and methodology
- DataSF: bicycle loop counter locations
- Golden Gate Weather Services: San Francisco monthly rainfall records
- SFMTA Valencia bikeway improvements project page
- SFMTA 2022 bike count and data update
- Lyft Urban Solutions, February 2026: a record-breaking 2025 for bikeshare
- Lyft Urban Solutions, March 2026: Bay Wheels Big Game week ridership
- SFMTA, January 2026: San Francisco traffic fatalities drop nearly half in 2025
- SF Standard, August 2026: e-bike and scooter injuries and Lyft fleet expansion
- Streetsblog SF, November 19, 2024: SFMTA approves removal of the Valencia center-running bike lane
- SFMTA Slow Streets program
- SF Standard, September 16, 2025: Joel Engardio recall election results
- Mission Local, July 2026: the Great Highway ballot measure qualifies for November
- SF Standard, August 11, 2026: the Controller prices reopening the Great Highway
- Local News Matters, April 2026: Sunset Dunes marks its first anniversary with 1.7 million visits
The Houseberry Research Team is Houseberry's reporting team: Bay Area real estate analysts, data specialists and longtime local market watchers. Every day we check the public record: building permits, city council and planning agendas, county recorder filings, state housing bills, police incident data and school results. Then we tie each story to what it means for specific neighborhoods, using Houseberry's own neighborhood data on prices, appreciation, safety, schools and amenities. Questions or corrections: Contact us.
Map of San Francisco Neighborhoods
Loading map...
View Full Map
Top Neighborhoods in San Francisco, CA


All information provided on this website including but not limited to - school ratings, safety, amenities, user opinions, and property data - is for general informational purposes only. We do not guarantee its reliability, accuracy, or completeness. Users should independently verify information and consult appropriate professionals as needed. By using this website, you agree Houseberry is not responsible for actions, decisions, or consequences arising from reliance on the information provided
houseberry.com - CA DRE# 01847391
 Bay East ©2025. CCAR ©2025. bridgeMLS ©2025. Information Deemed Reliable But Not Guaranteed. This information is being provided by the Bay East MLS, or CCAR MLS, or bridgeMLS. The listings presented here may or may not be listed by the Broker/Agent operating this website. This information is intended for the personal use of consumers and may not be used for any purpose other than to identify prospective properties consumers may be interested in purchasing. Data last updated at October 22, 2026 12:00 AM