Where the FAIR Plan grew fastest in the Bay Area and Sacramento
The FAIR Plan's own county counts from 2021 to 2025, Bay Area and Sacramento region side by side, plus the ZIP codes where the growth actually sits and what to do if a FAIR Plan quote shows up.

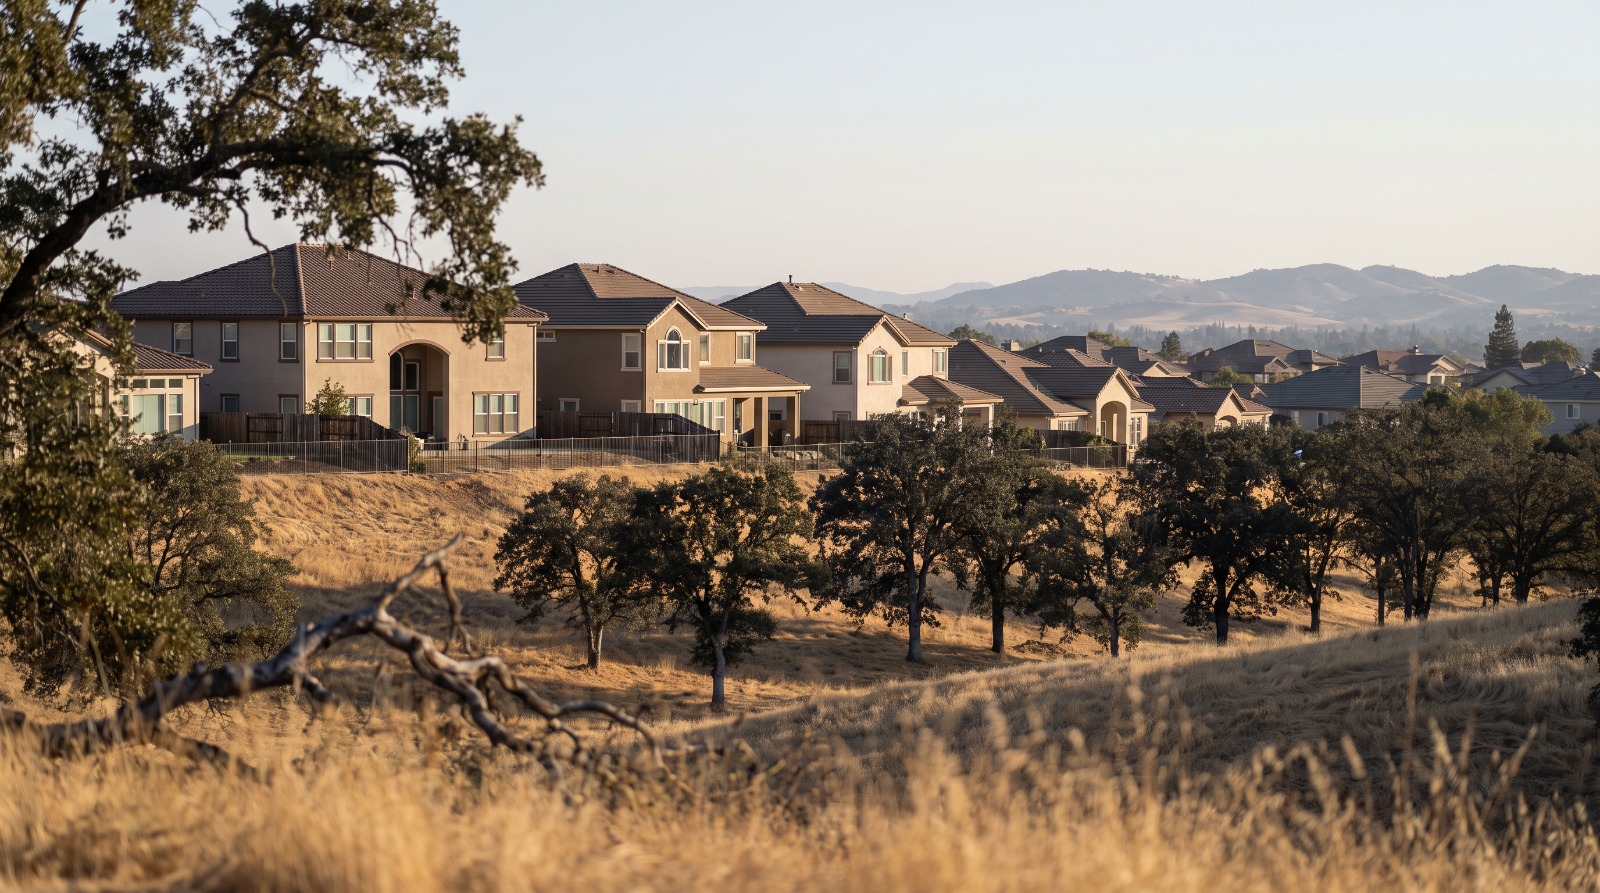
AI-rendered telephoto view of Folsom hillside homes among oak trees in eastern Sacramento County, where FAIR Plan policies have grown fastest Photo: Houseberry
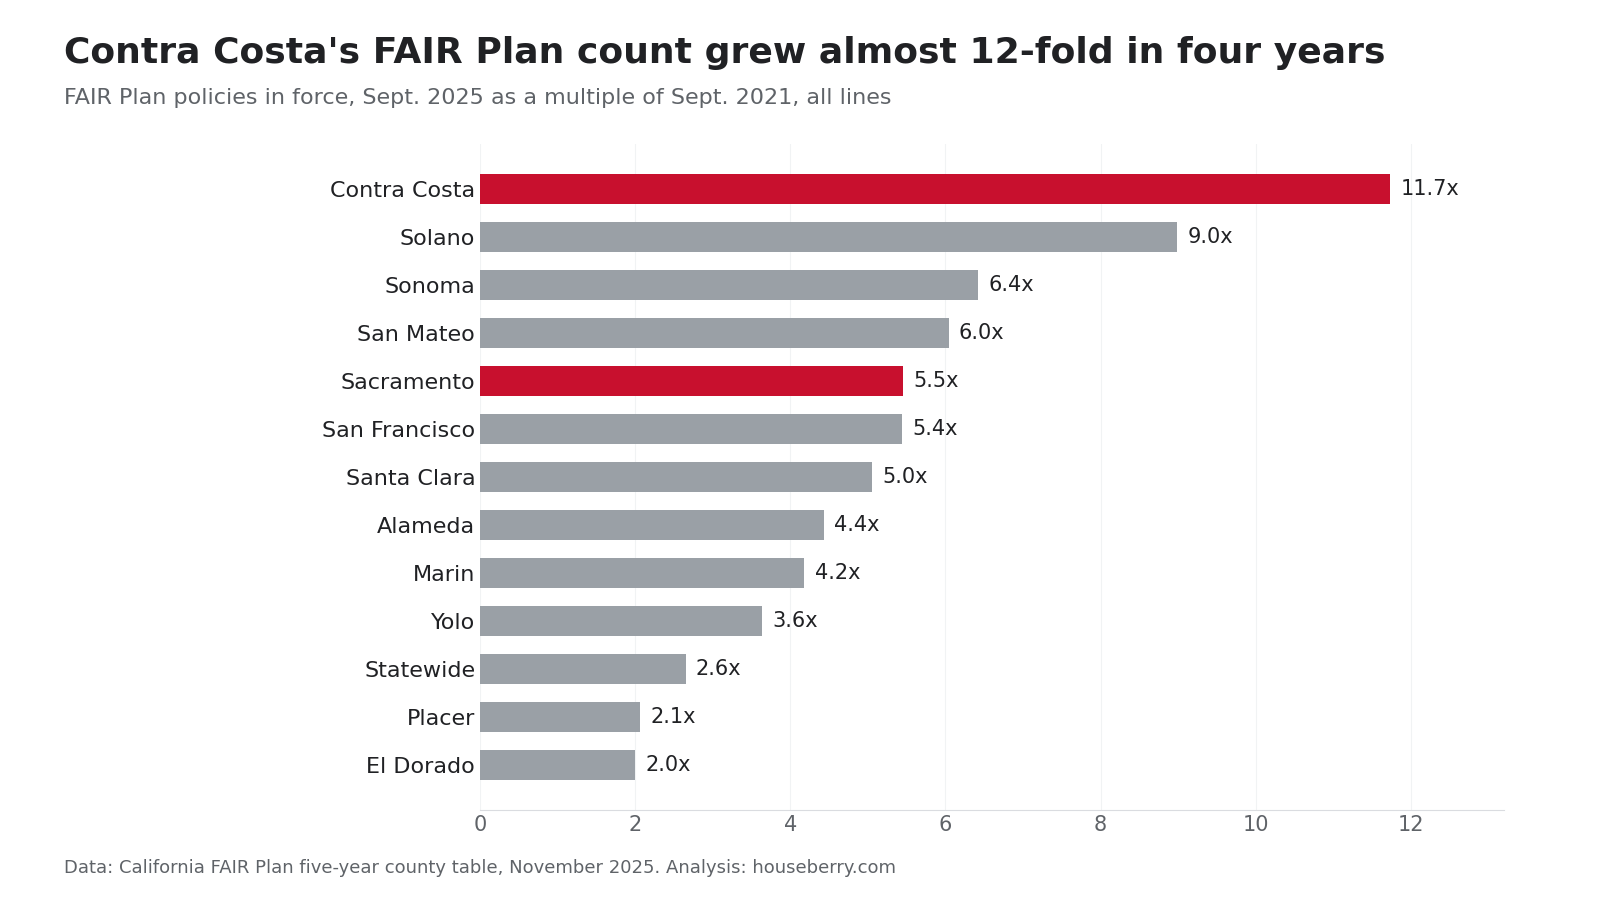
In September 2021, the California FAIR Plan had 367 policies in all of Sacramento County. Four years later it had 2,001. Contra Costa went from 1,094 to 12,837 over the same stretch, an 11.7-fold jump that pushed it past Alameda County for the first time in the table.
Those counts come from the FAIR Plan's own five-year county table, the insurer of last resort's tally of policies in force each Sept. 30. We lined up every Bay Area and Sacramento-region county side by side, then checked them against the plan's June 2026 count of homes by ZIP code. The county totals hide where the growth actually is. In Sacramento County it is Folsom and the eastern edge, where Houseberry's top-scored Folsom neighborhood, Empire Ranch, sits at 4.0 out of 5.
This is a story about who is being pushed onto a bare-bones fire policy, and how to tell whether your street is one of them.
The county table, 2021 to 2025
The county figures count every kind of FAIR Plan policy, homes and businesses together. The ZIP figures later in this post count homes only. The two series do not mix, so we keep them apart.
| County | Sept. 2021 | Sept. 2025 | Change |
|---|---|---|---|
| Contra Costa | 1,094 | 12,837 | 11.7 times |
| Solano | 146 | 1,312 | 9.0 times |
| Sonoma | 1,363 | 8,748 | 6.4 times |
| San Mateo | 622 | 3,759 | 6.0 times |
| Sacramento | 367 | 2,001 | 5.5 times |
| San Francisco | 438 | 2,382 | 5.4 times |
| Santa Clara | 1,228 | 6,200 | 5.0 times |
| Alameda | 2,638 | 11,694 | 4.4 times |
| Marin | 1,044 | 4,361 | 4.2 times |
| Yolo | 69 | 251 | 3.6 times |
| Placer | 9,213 | 18,996 | 2.1 times |
| El Dorado | 14,090 | 28,167 | 2.0 times |
| Statewide | 242,440 | 642,010 | 2.6 times |
Read the bottom two Sacramento rows carefully. Placer and El Dorado grew slower than the state because they started big. El Dorado already had 14,090 FAIR Plan policies in 2021, more than the entire Bay Area. The foothills were priced as fire country long before the cities were.
Sacramento County is the outlier in its own region. It grew like a Bay Area county: flat in 2022, up 28 percent in 2023, up 142 percent in 2024 and up 78 percent in 2025.
Where Sacramento's growth lands
The ZIP file, dated June 30, 2026, shows the county's FAIR Plan homes are not spread evenly. Folsom's 95630 has 300. That ZIP had eight in 2021, according to an Abridged analysis published Oct. 20. The Sloughhouse and Rancho Murieta area has 65, and east Elk Grove has 64.
The central city barely registers. North Natomas (95835) has 22 FAIR Plan homes, the Pocket (95831) has 14, the 95834 side of Natomas has 11, and East Sacramento (95819) has eight. That fits the ground. Natomas Park, which scores 4.4 out of 5 on safety in Houseberry's data, is a flat grid of 1990s and 2000s homes with no wildland edge.
Abridged lays out why Folsom changed. New state fire hazard maps put large parts of eastern Sacramento County in moderate or high zones, and insurers now screen homes with aerial imagery for tree limbs over roofs and worn shingles. Joel Laucher of United Policyholders told Abridged that State Farm may now write only about 3 in 10 new Folsom homes.
Across the county line the numbers get large fast. El Dorado Hills (95762) has 1,697 FAIR Plan homes. Auburn's 95603 has 2,105. Placerville's 95667 has 7,374, more than any other ZIP code in California.
The Bay Area hills are a different scale
One Orinda ZIP holds more FAIR Plan homes than all of Sacramento County. The Oakland hills ZIP 94611, around Montclair, has 2,822. Lafayette has 1,863 and Moraga 672.
Those are the places where the plan's 29.1 percent average rate increase, which took effect Oct. 15, lands hardest. We broke that hike down by ZIP code in our earlier FAIR Plan post. For context on the neighborhoods themselves, Orinda's rankings put El Toyonal first at 4.6 out of 5.
Our read on the numbers
We think the Sacramento County headline overstates the risk for most owners in the county. The fivefold jump is real, but it rests on Folsom and the eastern edge. For a house in Natomas or Land Park, a FAIR Plan quote is usually a sign to shop harder, not a sign of what the market thinks of the block.
The trade-off is that shopping is getting harder too. State Farm filed on Sept. 18 to reopen new homeowners policies for homes that meet a wildfire-hardening standard, and Allstate filed on Aug. 31, the Insurance Department said. Neither is writing yet.
If a FAIR Plan quote shows up
- Call several agents and brokers before you accept it, and ask which companies are writing new policies in your ZIP. Have your roof age, photos and electrical panel details ready.
- If you do take the FAIR Plan, add a difference-in-conditions policy. The FAIR Plan covers fire and smoke, not water damage, theft or liability.
- Claim the plan's mitigation discounts. Meeting all 12 measures, from a Class A roof to ember-resistant vents, takes up to 16.4 percent off the wildfire portion of the premium, per the FAIR Plan's discount schedule.
- Ask again at every renewal. The FAIR Plan is meant to be the last resort, not the long-term policy.
If you are weighing a move inside the region, compare where the FAIR Plan counts are low against how the neighborhoods score on Houseberry's Sacramento rankings, then look up any address on the Houseberry map before you request a quote.
Sources
- California FAIR Plan, "Policy Growth by Fiscal Year, Data by County," November 2025
- California FAIR Plan, residential policies by ZIP code, as of June 30, 2026
- California FAIR Plan, key statistics and mitigation discount schedule
- California Department of Insurance, FAIR Plan growth update, Aug. 3, 2026, and insurer filings notice, Sept. 18, 2026
- Abridged (KVIE), "Use of last-resort fire insurance rises sharply in Sacramento County," Oct. 20, 2026
- KRCR, FAIR Plan rate increase approval, May 22, 2026
- Houseberry neighborhood scores, October 2026
The Houseberry Research Team is Houseberry's reporting team: Bay Area real estate analysts, data specialists and longtime local market watchers. Every day we check the public record: building permits, city council and planning agendas, county recorder filings, state housing bills, police incident data and school results. Then we tie each story to what it means for specific neighborhoods, using Houseberry's own neighborhood data on prices, appreciation, safety, schools and amenities. Questions or corrections: Contact us.
Map of Sacramento Neighborhoods
Loading map...
View Full Map
Top Neighborhoods in Sacramento, CA





All information provided on this website including but not limited to - school ratings, safety, amenities, user opinions, and property data - is for general informational purposes only. We do not guarantee its reliability, accuracy, or completeness. Users should independently verify information and consult appropriate professionals as needed. By using this website, you agree Houseberry is not responsible for actions, decisions, or consequences arising from reliance on the information provided
houseberry.com - CA DRE# 01847391
 Bay East ©2025. CCAR ©2025. bridgeMLS ©2025. Information Deemed Reliable But Not Guaranteed. This information is being provided by the Bay East MLS, or CCAR MLS, or bridgeMLS. The listings presented here may or may not be listed by the Broker/Agent operating this website. This information is intended for the personal use of consumers and may not be used for any purpose other than to identify prospective properties consumers may be interested in purchasing. Data last updated at October 22, 2026 12:00 AM