San Jose Homeless Count: The Drop Came With a New Method
San Jose says street homelessness fell 32 percent in 18 months, but the number comes from a new city data model, not the point-in-time count. How the method changed, what critics say, and what it means for San Jose neighborhoods.
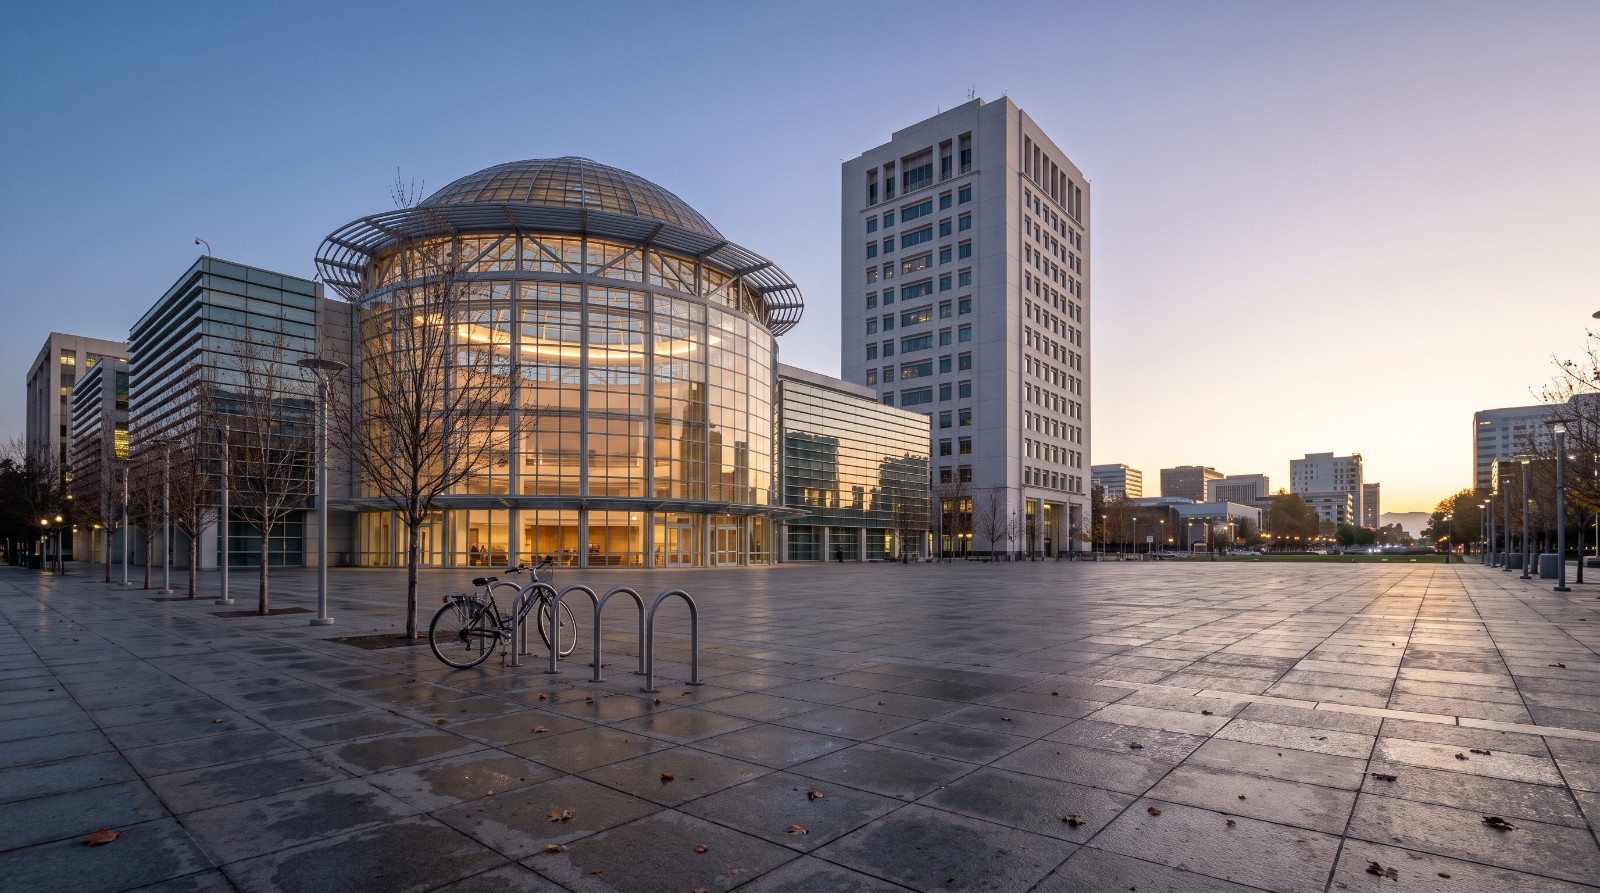
San Jose City Hall rotunda at dawn over an empty plaza, where the city announced its new homeless count methodology. Photo: Houseberry
Did San Jose really get a third of its street homelessness off the streets in a year and a half? It is a fair question after last week's headline, and one plenty of San Jose parents and house hunters are asking.
Here is the short answer. The city says unsheltered homelessness fell 32 percent in 18 months, to about 3,700 people in August 2026. But the thing that changed first was the method. San Jose stopped leaning on the federal point-in-time count and built a new data model with the AI firm UrbanLogiq, and the 32 percent is measured on that new yardstick. Advocates say the number does not match what they see on the ground.
What changed: the way San Jose counts
The biggest change in this story is the measuring tape, not the street. For years, San Jose's official number came from the point-in-time count, a federally required survey where volunteers fan out over two nights every other winter and tally who they find outside.
Everyone, including the mayor, agrees that count misses people. "The frustration we hear with the Point-in-Time count, the inaccuracy, the likely undercount, the infrequency, is legendary," Mayor Matt Mahan said at the September 16 news conference, as KTVU reported.
So the city built its own estimate. According to San José Spotlight, the model combines police and fire encounters with homeless residents, counts of lived-in vehicles, the countywide Homeless Management Information System (the database where outreach workers log their contacts), and other sources. KTVU and ABC7 describe it as an algorithm running on 15 data points. ABC7 reports the city calls it "independently verified." As of September 28, we could not find a published methodology or the name of the verifier, which is the first thing I would want to see.
The model's upside is real. A quarterly number lets the city see whether a new shelter site or an encampment policy is working this season, not two years from now. Housing Director Erik Soliván framed it as understanding the "constant demand" of people falling into homelessness, per the Spotlight.
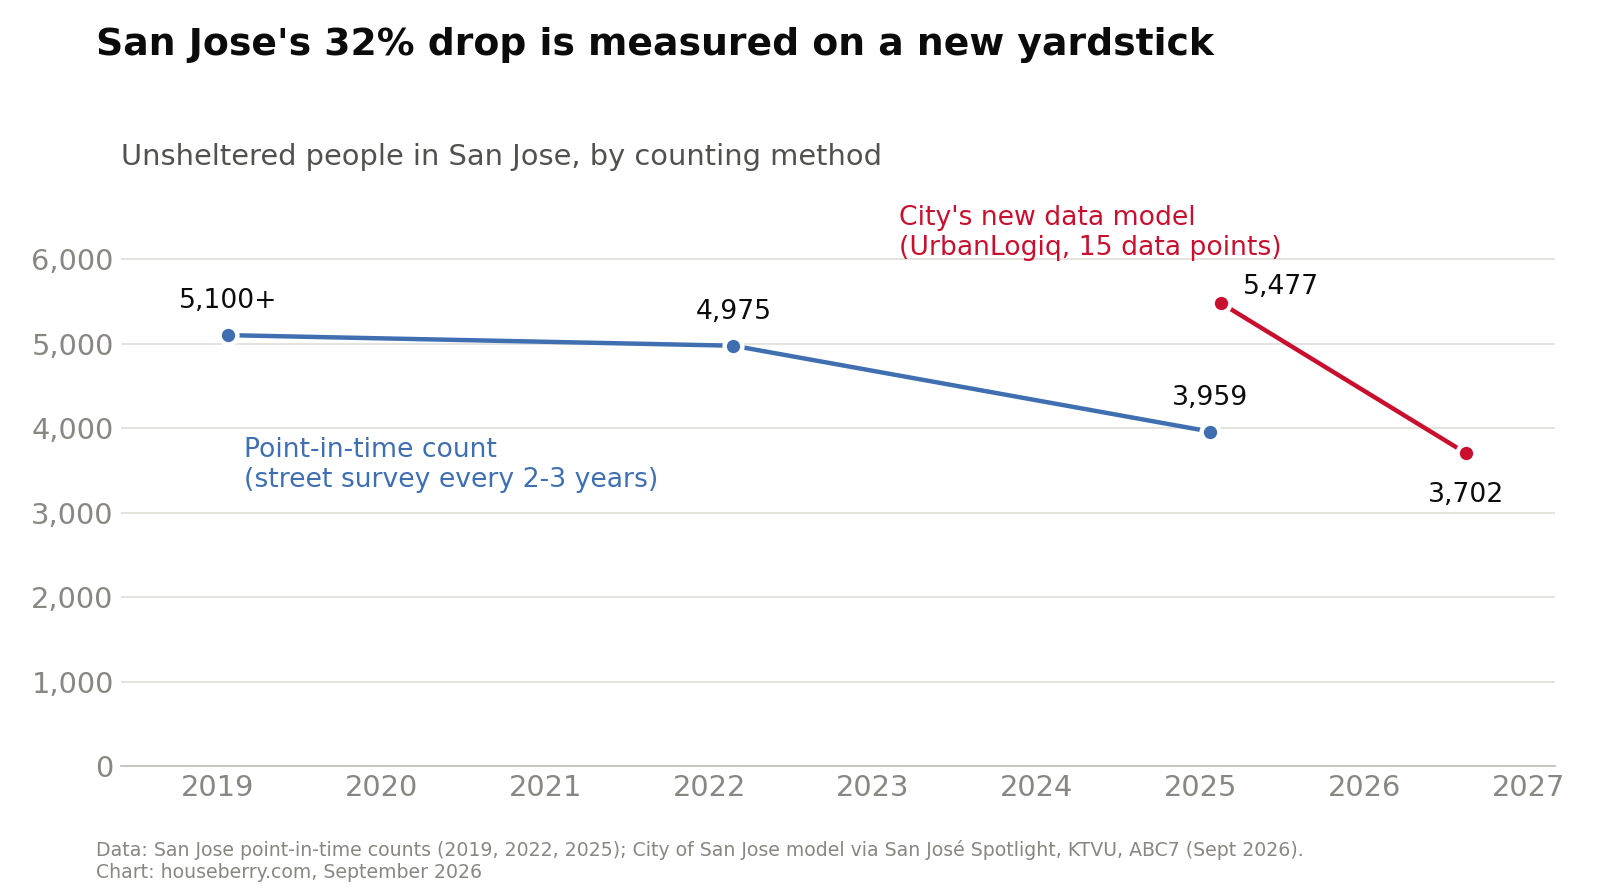
Look at the two lines. They are not one series. The blue line is the street survey, which peaked near 5,000 unsheltered people in 2022 and fell to 3,959 in 2025. The red line is a different instrument that starts in a different place.
Is the 32 percent a like-for-like comparison?
Only inside the model. As reported, both ends of the 32 percent are the city's own estimates, not point-in-time counts, so the model is at least being compared with itself. What you cannot do is line it up against the point-in-time counts San Jose has cited for years and call it a continuation of that trend.
Here is why that matters. Mahan said the model estimated about 1,500 more unsheltered people than the county's count. A tool that starts higher has more room to fall. If you set August's 3,702 next to the January 2025 street count instead, the gap is 257 people, or about 6 percent.
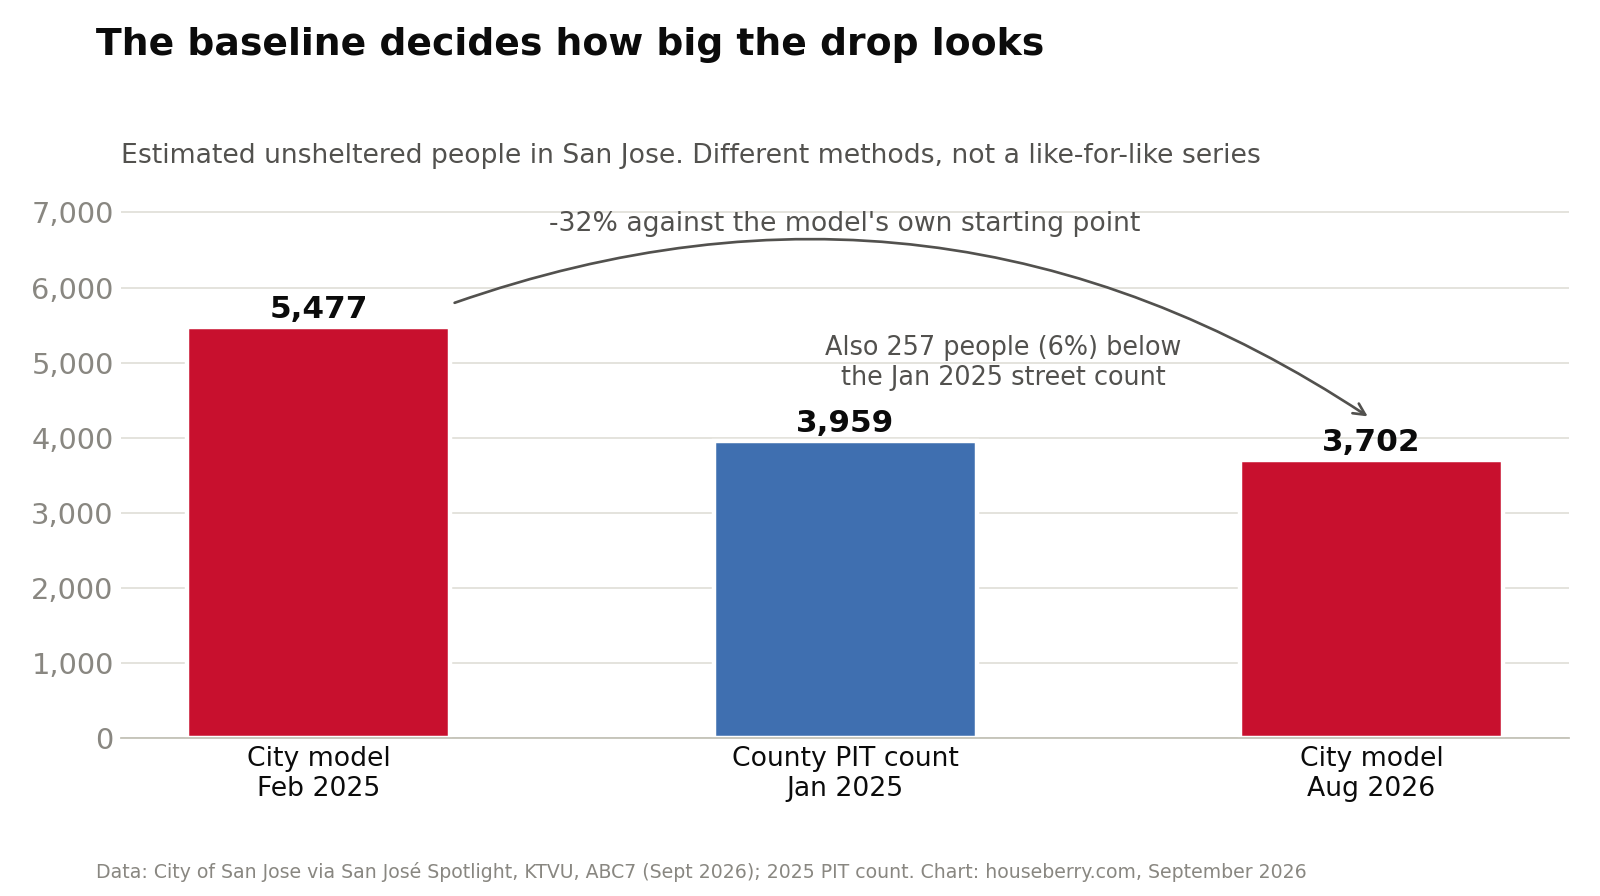
To be clear, that 6 percent is not a valid comparison either. It mixes two methods, which is exactly the problem. The honest reading is that the city's model shows a large decline by its own measure, and nobody yet has a like-for-like, independent number to confirm or refute it.
Here is how the two approaches stack up side by side.
| Point-in-time count | City's new model | |
|---|---|---|
| Who runs it | Santa Clara County, federally required | City of San Jose, built with UrbanLogiq |
| How often | Two nights, every other winter | Every quarter |
| How it counts | Volunteers tally people found outside | Algorithm on 15 data points (police, fire, vehicles, outreach records) |
| Latest unsheltered figure | 3,959 (January 2025) | 3,702 (August 2026) |
| Known weakness | Widely considered an undercount | No public methodology or named verifier found as of Sept 2026 |
The model may well be the better tool. Point-in-time counts really are blunt. But a better tool still needs a published manual before a headline number built on it can carry this much weight.
What the critics say
The sharpest objection is simple: the people who work the streets every day do not see a one-third drop. Shaunn Cartwright of the Unhoused Response Group put the question directly to reporters, per ABC7: does it seem like there is a 32 percent decrease? "No." She added that deaths are on pace to match last year's 160, and questioned whether the new metric exists to give the mayor "a more favorable number."
Bea Nasser, a homeless advocate, argues the drop reflects people being moved out of view more than out of homelessness. She told the Spotlight that of 16 Columbus Park residents she helped move into a Motel 6 program, 12 ended up back outside, many removed over belongings limits. Her read: the city is driving "a numbers-first approach with people who have lives."
Sandy Perry, also of the Unhoused Response Group and a longtime Mahan critic, gave the mayor credit for vastly expanding shelter capacity, per CBS News Bay Area, but warned that without truly affordable housing the system is "somewhat stuck."
City leaders have acknowledged the algorithm is not perfect, KTVU reported, and there is an open question about which number state and federal funders will use. Mahan's defense is speed. The city wants a number "not once every two years, like the PIT count, but at least once every quarter in near real time," he said, per ABC7.
The part nobody is arguing about: San Jose built a lot of shelter
Whatever you think of the 32 percent, the shelter numbers are not in dispute. The county's 2025 count found 2,544 sheltered people in San Jose, up from 980 in 2019, and the city says it has added about 1,000 interim housing units. The 2025 count still found 6,503 homeless residents in total, up slightly from 2023.
That is the pattern I would watch. More people are inside, in tiny home communities and converted motels, but the total has not gone down. The bottleneck is permanent housing. About 6,000 households are waiting for it in Santa Clara County, per the Spotlight, and the city's own scorecard says San Jose is short more than 3,000 shelter and interim units. Interim beds buy time. Only more homes, of every price, end the wait. (We looked at the state side of that funding pipeline in our piece on California's new housing and homelessness agency.)
What it means if you are house hunting in San Jose
For buyers, the practical takeaway is that a citywide homeless number, old method or new, tells you very little about a specific block. What you experience is local: a creek corridor, a freeway underpass, a stretch of RVs near a business park.
San Jose is a big, uneven city. Our San Jose neighborhood rankings cover 112 neighborhoods, and the city scores 3.5 out of 5 on safety overall. On our San Jose safety rankings, The Villages in the Evergreen foothills tops the list at 4.8, while downtown-adjacent areas score lower. We walked through that spread in Is San Jose Safe? What 112 Neighborhood Scores Show.
Prices have not moved on this news, and I would not expect them to. The San Jose median sale price was about $1.63 million in August 2026 on our San Jose city page, inside the same $1.59 million to $1.68 million band it has held for a year. If you are weighing a particular home, walk the surrounding blocks at a few different times of day, check the nearest creek trail, and read the city's quarterly updates as they come out. That tells you more than any single headline figure.
This does not make any neighborhood better or worse overnight. It changes what is worth checking, and that is how we try to look at every area on Houseberry: the blocks first, then the house.
The real test comes in early 2027, when the next federally required point-in-time count happens. If the street survey also shows a sharp drop from 3,959, the city's model will have earned a lot of trust. If it does not, expect this argument to get louder.
Sources
- San José Spotlight: New methodology reveals drop in San Jose street homelessness (Sept 19, updated Sept 24, 2026)
- KTVU FOX 2: San Jose reports 32% drop in homeless population with new tracking model (Sept 16, 2026)
- ABC7 News: San Jose sees 32% drop in unsheltered residents, according to data (Sept 17, 2026)
- CBS News Bay Area: San Jose mayor says city's homeless population has dropped by 32% (Sept 17, 2026)
- San José Spotlight: San Jose homeless population is still rising (July 2025)
- Local News Matters: San Jose homeless population is still rising despite more temporary, permanent housing (July 18, 2025)
- Office of Mayor Matt Mahan: 2025 point-in-time count release (July 14, 2025)
- City of San José: How the City is Reducing Unsheltered Homelessness (FY2025-2026)
- Houseberry: San Jose city page, neighborhood rankings, and safety rankings (September 2026)
Map of San Jose Neighborhoods
Loading map...
View Full Map
Top Neighborhoods in San Jose, CA


All information provided on this website including but not limited to - school ratings, safety, amenities, user opinions, and property data - is for general informational purposes only. We do not guarantee its reliability, accuracy, or completeness. Users should independently verify information and consult appropriate professionals as needed. By using this website, you agree Houseberry is not responsible for actions, decisions, or consequences arising from reliance on the information provided
houseberry.com - CA DRE# 01847391
 Bay East ©2025. CCAR ©2025. bridgeMLS ©2025. Information Deemed Reliable But Not Guaranteed. This information is being provided by the Bay East MLS, or CCAR MLS, or bridgeMLS. The listings presented here may or may not be listed by the Broker/Agent operating this website. This information is intended for the personal use of consumers and may not be used for any purpose other than to identify prospective properties consumers may be interested in purchasing. Data last updated at September 28, 2026 12:00 AM