Safest neighborhoods in San Francisco, and where to stay
San Francisco's 10 safest neighborhoods, which hotel districts score highest, and straight answers on Union Square, the Mission and Fisherman's Wharf, all from two years of police data.

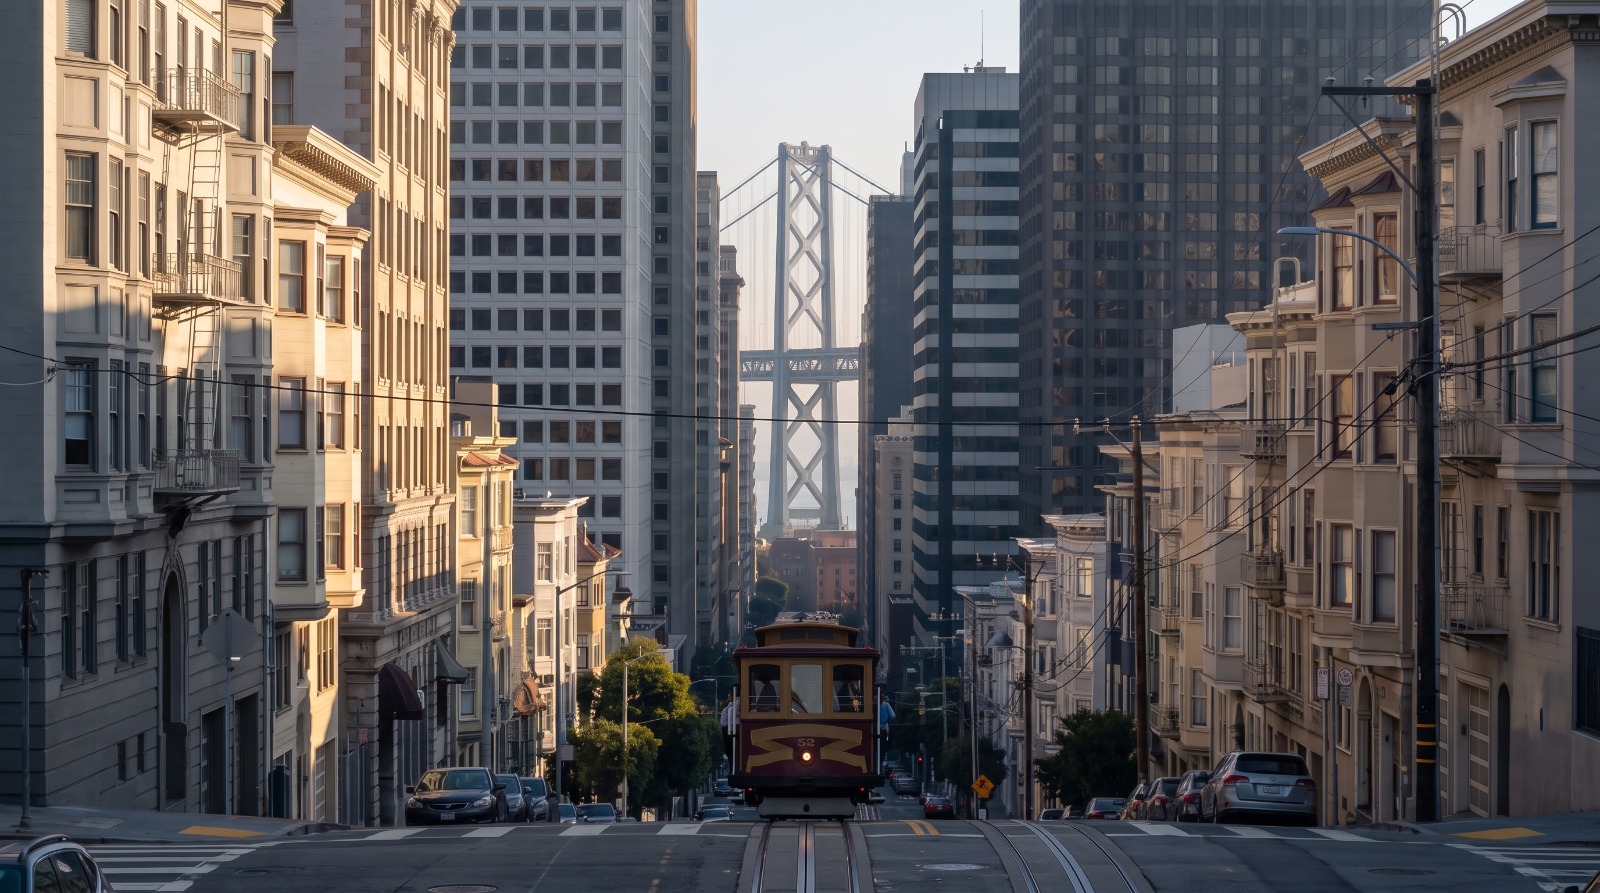
AI-rendered view down California Street from Nob Hill in San Francisco, a cable car climbing toward the camera with the Bay Bridge beyond Photo: Houseberry
From the Fairmont's front steps on Nob Hill down to Union Square is about half a mile, an eight-minute walk downhill. On Houseberry's safety scores, those two places sit 1.7 points apart. Nob Hill scores 4.1 out of 5. Downtown, the neighborhood that holds Union Square, scores 2.4.
That gap is the real answer to two questions people type into Google every day: which San Francisco neighborhoods are safest, and where should you stay. The city is safer than its reputation. According to Houseberry data for October 2026, 53 of San Francisco's 92 scored neighborhoods rate 4 out of 5 or better. The trouble is that most hotel rooms sit in the handful of downtown neighborhoods that score lowest. This guide covers both, the places people live and the places people stay, using one yardstick built from police incident reports.
San Francisco's 10 safest neighborhoods in 2026
Ties are broken by Houseberry's unrounded score, the same order the ranking page uses.
1. Sherwood Forest, 4.8
2. Westwood Park, 4.8
3. Midtown Terrace, 4.7
4. Monterey Heights, 4.7
5. Westwood Highlands, 4.7
6. Merced Heights, 4.7
7. Pine Lake Park, 4.7
8. Forest Knolls, 4.7
9. Jordan Park / Laurel Heights, 4.6
10. Inner Parkside, 4.6
Notice what is missing. Not one famous neighborhood makes the top ten. Sherwood Forest is a few hundred homes on the slopes of Mount Davidson with curving streets and almost no through traffic. Westwood Park is a 1920s bungalow tract next to City College. Over the two years we measured, Houseberry counted zero violent incidents in either one.
The pattern holds well past the top ten. The residential west side, the blocks between Twin Peaks and Ocean Beach, is where San Francisco's scores pile up. Parkside, home to about 18,000 people, scores 4.6 and logs 0.78 violent incidents per 1,000 residents a year. Van Ness/Civic Center logs 27.1. That is a 35-fold difference inside one 47-square-mile city.
Where to stay in San Francisco, ranked by safety
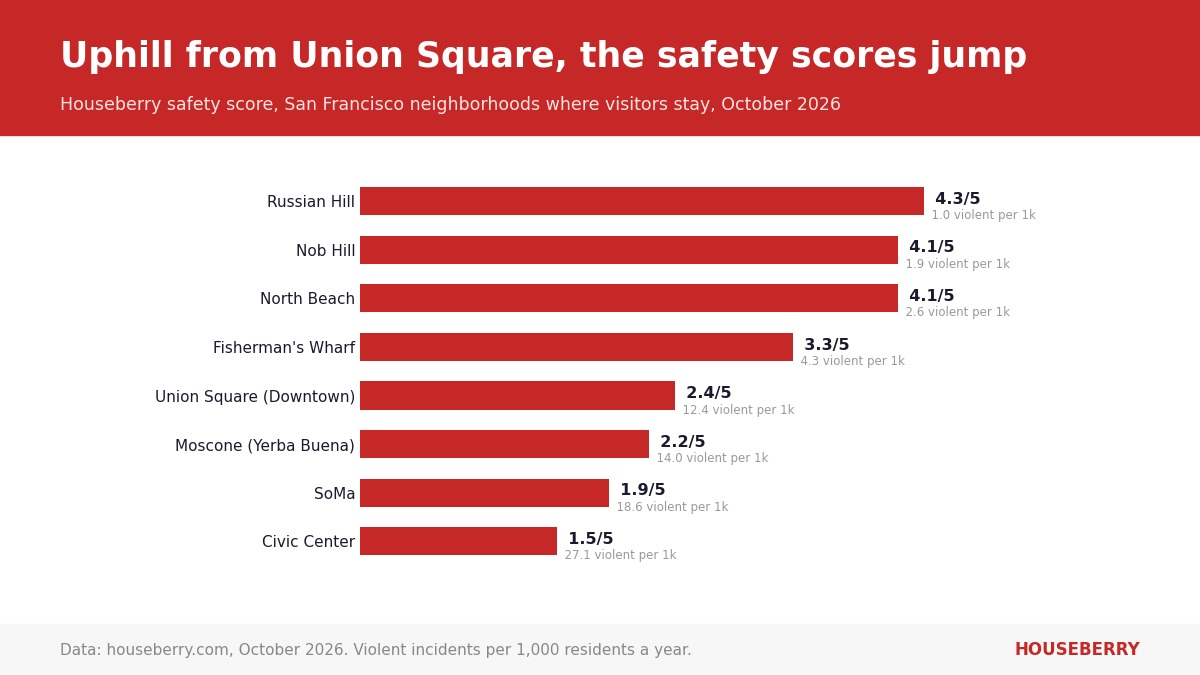
Most visitors book by convenience, and convenience in San Francisco means downtown. The table below lines up the neighborhoods where visitors actually book, hotels or short-term rentals, against their Houseberry safety scores. The high scorers are not far away. Russian Hill and Nob Hill sit uphill from Union Square, North Beach is a short walk from the Financial District, and the Presidio and the Inner Sunset put you next to the city's two big parks.
| Where you'd stay | Houseberry neighborhood | Safety score | Violent incidents per 1,000 residents a year |
|---|---|---|---|
| The Presidio lodges | Presidio | 4.5 | not tracked by SFPD (U.S. Park Police) |
| Russian Hill | Russian Hill | 4.3 | 1.0 |
| Inner Sunset, by Golden Gate Park | Inner Sunset | 4.3 | 1.4 |
| Nob Hill | Nob Hill | 4.1 | 1.9 |
| North Beach | North Beach | 4.1 | 2.6 |
| The Marina | Marina | 4.1 | 1.9 |
| Mission Bay, by Chase Center | Mission Bay | 3.9 | 3.2 |
| Hayes Valley | Hayes Valley | 3.7 | 2.9 |
| Lombard Street motels | Cow Hollow | 3.6 | 3.6 |
| Fisherman's Wharf | North Waterfront | 3.3 | 4.3 |
| Union Square | Downtown | 2.4 | 12.4 |
| Financial District | Financial District/Barbary Coast | 2.3 | 12.5 |
| Moscone Center | Yerba Buena | 2.2 | 14.0 |
| SoMa | South of Market | 1.9 | 18.6 |
| Civic Center | Van Ness/Civic Center | 1.5 | 27.1 |
The jump is sharp. Every neighborhood above Fisherman's Wharf in that table logs fewer than four violent incidents per 1,000 residents a year. Every one below it logs more than twelve.
Nob Hill and Russian Hill, uphill from the shopping
If you want Union Square without sleeping on it, this is the move. Nob Hill's violent-incident rate, 1.9 per 1,000 residents a year, is about one sixth of Downtown's 12.4, and the Powell and California cable car lines connect the two. Russian Hill does even better at 4.3, with fewer hotels and more short-term rentals and small inns. The trade-off is the hill itself. Nob Hill's crest sits more than 200 feet above Union Square.
North Beach and the Marina
North Beach scores 4.1, and its residential property crime rate, 4.8 burglaries, car thefts and arsons per 1,000 residents, is lower than Pacific Heights'. The Marina also scores 4.1. The Lombard Street motel strip falls inside Cow Hollow, which scores 3.6, mostly because of car break-ins.
Fisherman's Wharf: the streets are fine, the parked cars are not
Fisherman's Wharf is the clearest case of a place where the usual crime math lies. Only about 1,900 people live in the North Waterfront neighborhood, and Pier 39 alone reports 10 million to 15 million visitors a year. Divide crime by residents alone and the Wharf scores 1.75, worse than the Tenderloin. So for visitor districts we divide by everyone who is actually there, residents plus workers plus average daily visitors, and that puts the Wharf at 3.3.
The number that survives any adjustment is car break-ins: about 26 a year for every 1,000 people present at the Wharf, against 7.5 citywide. Lincoln Park, home to the Lands End trail and the Legion of Honor, runs almost exactly the same. Leave nothing visible in a rental car at either one, and that includes the trunk you load in the parking lot.
Is Union Square safe?
During the day, Union Square is one of the most heavily watched blocks in the city. SFPD keeps foot-beat officers there, and CBS News reported in December 2023 that the department added retired officers as uniformed ambassadors who radio in trouble and help tourists. The neighborhood's score is still 2.4, and that number is honest about what happens across the whole Downtown neighborhood, day and night.
Two caveats matter for a visitor. First, scores are built per resident, and Downtown has about 22,500 residents and far more people passing through, so the per-person risk to any one shopper is lower than the raw rate suggests. Second, the trend is moving the right way. SFPD's Central District, which covers Union Square, Chinatown, North Beach, Nob Hill and the Wharf, saw property crime fall 38.7 percent in 2025, according to the San Francisco Examiner's analysis. The Southern District, which covers SoMa, was the exception, with property crime up 22.6 percent.
Our view: Union Square is a fine place to shop and a weaker place to book a bed. For the same budget, a Nob Hill hotel puts you ten minutes from the same stores in a neighborhood that scores 1.7 points higher.
The lowest-scoring San Francisco neighborhoods
People search this as "areas to avoid." We would put it differently: these are the places where Houseberry's numbers are lowest, and where it pays to plan your walk at night. Eight neighborhoods score 2.4 or lower. Six of them sit in the downtown core between Van Ness Avenue and the Bay. The other two are the Inner Mission and Bayview.
- Van Ness/Civic Center, 1.5
- South of Market, 1.9
- Inner Mission, 2.0
- Tenderloin, 2.1
- Yerba Buena, 2.2
- Financial District/Barbary Coast, 2.3
- Downtown, 2.4
- Bayview, 2.4
The Tenderloin has one surprising line. Its car break-in rate, 3.7 per 1,000 residents, is about half the Marina's 7.1. Car break-ins follow parked cars.
Is the Mission safe? It depends which Mission
The Mission splits in two on our map. The Inner Mission, the Mission Street and 16th Street corridor with about 39,000 residents, scores 2.0. Mission Dolores, the blocks around Dolores Park and the old mission, scores 3.8. The Castro, which Houseberry maps as Eureka Valley / Dolores Heights, scores 3.7, and Noe Valley next door scores 4.2. The Haight scores 3.7. By the Examiner's count, SFPD's Mission District logged 639 violent incidents in 2025 through December 21, down 24.4 percent from 2024, the steepest drop of any major district.
How Houseberry scores safety
We pulled SFPD's public incident reports from DataSF for July 2024 through July 2026, about 37,000 incidents, and placed each one inside Houseberry's own neighborhood boundaries. Each neighborhood gets three rates per 1,000 residents a year: violent crime (robbery, aggravated assault, homicide, rape), residential property crime (home burglary, car theft, arson) and car break-ins. Shoplifting and simple assault are left out because they say little about the block you sleep on.
The rates are scored against California-wide averages, so a 4.1 in San Francisco means the same thing as a 4.1 in Oakland or San Jose. Parks and visitor districts (Golden Gate Park, Fisherman's Wharf, Lands End) are scored against everyone present, not just residents. The Presidio is patrolled by the U.S. Park Police rather than SFPD, so its 4.5 is an estimate, discounted for car break-ins at Baker Beach and the overlooks.
Questions people ask about San Francisco safety
What is the safest neighborhood in San Francisco? Sherwood Forest and Westwood Park tie at 4.8 out of 5 on Houseberry's 2026 scores. Both are small, quiet residential pockets near Mount Davidson and City College.
Is San Francisco safe for tourists? For most trips, yes, with two habits. Pick a hotel in a neighborhood that scores 4 or higher, and never leave bags in a parked car. Car break-ins, not violent crime, are the crime most visitors actually meet.
Is crime going down in San Francisco? Yes. SFPD reported a 25 percent drop in total crime in 2025, and GrowSF's tally of city data through March 29, 2026 showed total crime down another 28 percent year over year, though shootings were slightly up.
Is it safe to walk in San Francisco at night? In most of the city, the numbers say yes. The exceptions are the eight neighborhoods listed above, where the violent-incident rate runs from 12 to 27 per 1,000 residents a year. Use a car or transit to cross Civic Center and SoMa after dark.
Is San Francisco safer than Oakland? On Houseberry's shared scale, San Francisco's neighborhoods average 3.9 out of 5, and Oakland's average 2.8. See the Oakland safety ranking for the block-by-block picture.
We covered the citywide question in more depth in Is San Francisco Safe in 2026?. If you are choosing a hotel this week or a lease this year, open Houseberry's San Francisco safety ranking and look up the exact neighborhood before you book. The difference between 2.4 and 4.1 is about eight minutes on foot.
Sources
- San Francisco Police Department, 2025 year-end crime announcement, January 2, 2026
- San Francisco Examiner, SF crime kept falling in 2025, but the drop wasn't citywide
- GrowSF, Crime falls further, April 10, 2026
- DataSF, Police Department Incident Reports: 2018 to Present
- Houseberry, San Francisco neighborhood safety ranking, October 2026
The Houseberry Research Team is Houseberry's reporting team: Bay Area real estate analysts, data specialists and longtime local market watchers. Every day we check the public record: building permits, city council and planning agendas, county recorder filings, state housing bills, police incident data and school results. Then we tie each story to what it means for specific neighborhoods, using Houseberry's own neighborhood data on prices, appreciation, safety, schools and amenities. Questions or corrections: Contact us.
Map of San Francisco Neighborhoods
Loading map...
View Full Map
Top Neighborhoods in San Francisco, CA


All information provided on this website including but not limited to - school ratings, safety, amenities, user opinions, and property data - is for general informational purposes only. We do not guarantee its reliability, accuracy, or completeness. Users should independently verify information and consult appropriate professionals as needed. By using this website, you agree Houseberry is not responsible for actions, decisions, or consequences arising from reliance on the information provided
houseberry.com - CA DRE# 01847391
 Bay East ©2025. CCAR ©2025. bridgeMLS ©2025. Information Deemed Reliable But Not Guaranteed. This information is being provided by the Bay East MLS, or CCAR MLS, or bridgeMLS. The listings presented here may or may not be listed by the Broker/Agent operating this website. This information is intended for the personal use of consumers and may not be used for any purpose other than to identify prospective properties consumers may be interested in purchasing. Data last updated at October 6, 2026 12:00 AM