Bay Area Luxury Home Sales Up 39 Percent: Where the Line Sits
Redfin counted 39 percent more luxury sales in the San Francisco metro and 13 percent more around Oakland in the first half of 2026. Here is what luxury means in dollars in each metro, which Houseberry-scored neighborhoods clear the line, and what the jump means if you are shopping under $1.5 million.

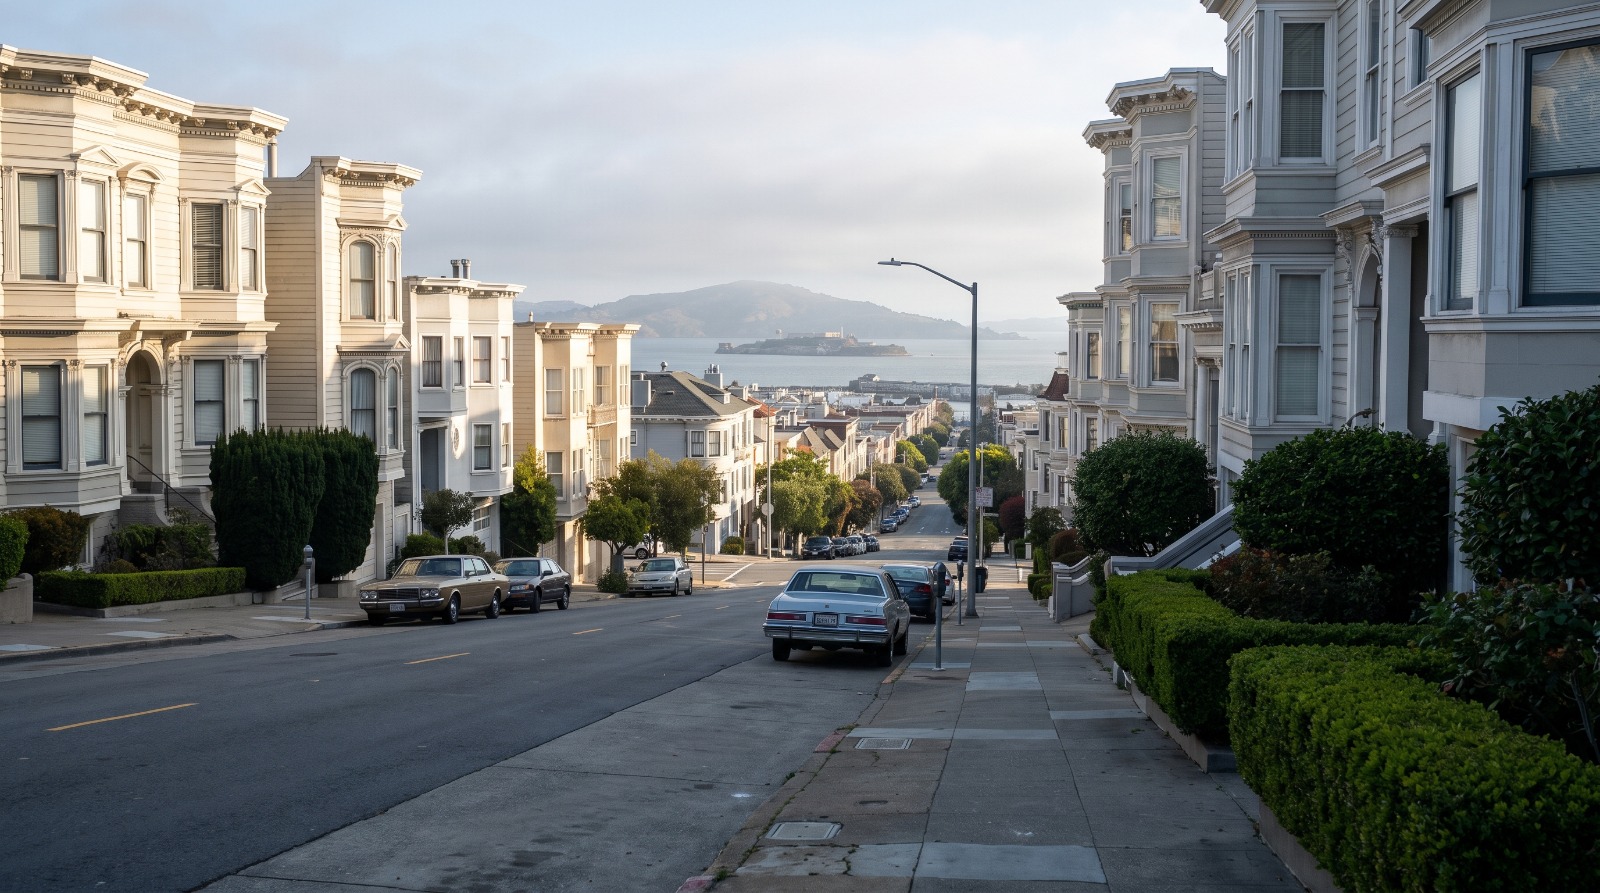
Morning view down a steep Pacific Heights street toward San Francisco Bay, the kind of block where Bay Area luxury home sales rose 39 percent in the first half of 2026. Photo: Houseberry
A five-bedroom in Orinda that closed this year at $3.3 million counts as a luxury sale in Redfin's Oakland data. In San Francisco, the same $3.3 million is about half of what the median top-tier home sold for this spring. That gap, not the headline percentage, is the story behind the Bay Area luxury home sales numbers the Associated Press published this week.
The short version. Redfin counted 39.3 percent more luxury sales in the San Francisco metro in the first half of 2026 than a year earlier, and 13.3 percent more in the Oakland metro, per the AP report by Alex Veiga. Luxury sits at a different dollar line in every metro, most of the Oakland gain happened outside Oakland proper, and if your budget stops around $1.5 million, the report measured a market you are not shopping in.
This is the third chapter of a story we have followed all year. In May we covered the price side, when Redfin showed luxury zip codes up 13.4 percent since ChatGPT launched while the cheapest ones lost value, and in July we walked through the IPO lockup calendar. This one is about transactions, not prices.
What Redfin counted, and how small the base is
Redfin defines luxury as the top 5 percent of a metro's homes by price and middle market as the homes closest to the median, and the AP piece compares closed sales in both tiers for January through June 2026 against 2025. Nationally the tiers barely moved, luxury up 2 percent and middle market up 1.9 percent. The Bay Area is where they came apart.
| Market | Luxury sales, H1 2026 vs H1 2025 | Middle-market sales, same period | Gap |
|---|---|---|---|
| San Francisco metro | +39.3 percent | +15.1 percent | 24.2 points |
| Oakland metro | +13.3 percent | +3.9 percent | 9.4 points |
| United States | +2.0 percent | +1.9 percent | 0.1 points |
The honest caveat is the base. Five percent of a metro's sales is a few hundred closings in a half year, so 39 percent is not thousands of mansions. It is also not a blip: Redfin's own three months ending May 31 had San Francisco luxury closed sales up 46.3 percent, and its April window was the strongest of any metro since June 2021.
Luxury is a different dollar line in every metro
Redfin does not publish the cutoff for the top 5 percent. It publishes the median sale inside that tier, which tells you where the center of luxury sits. For the three months ending May 2026 that was $6,648,922 in the San Francisco metro, $5,654,565 in San Jose, and $2,999,012 in Oakland.
So the Orinda buyer in the AP story, an AI infrastructure executive who paid $3.3 million after a year of looking, landed at the center of the Oakland top tier. Across the Bay Bridge that is upper-middle money. Redfin's zip-code work from May put the San Francisco luxury tier at roughly $3.1 million to $7.6 million, so one metro's entry ticket is the other metro's median.
Oakland's 13.3 percent is mostly not Oakland
Redfin's Oakland metro is Alameda and Contra Costa counties together, so Piedmont, Orinda, Lafayette, Alamo, Danville, and Blackhawk all count as Oakland. The top 5 percent of that market is those towns plus a thin slice of the Oakland hills, and our neighborhood numbers show how thin.
Oakland the city had a median home price of about $974,000 in August 2026 on our city page. Its priciest scored neighborhoods do not come close to the $3 million tier center: Upper Rockridge was about $2.08 million in August 2026, Crocker Highlands about $1.99 million the same month, and Montclair about $1.84 million in July 2026. Crocker Highlands holds the best overall score in the city at 4.3 out of 5 and still sits a million dollars under the line.
So the neighborhoods most Oakland buyers think of as the top of the market are, in Redfin's cut, neither luxury nor middle. The 13.3 percent describes Piedmont and the Lamorinda hills far more than Rockridge. Orinda, where the AP's buyer landed, had a citywide median of about $1.94 million in July 2026 and a 4.9 school score on our Orinda rankings.
The number that deserves more attention is the other Oakland figure. Middle-market sales rose 3.9 percent, the closest thing to flat in the whole report. Shopping in Oakland under $1.5 million? Demand at your price point barely moved.
Which Houseberry-scored neighborhoods clear the line
The table puts our current neighborhood medians next to Redfin's luxury median for each metro. Two San Francisco neighborhoods sit well above the line. Every East Bay neighborhood we score sits below it, including the best-scored ones.
| Neighborhood | Redfin luxury median, its metro | Houseberry median (month) | Overall score | Above or below the line |
|---|---|---|---|---|
| Pacific Heights, San Francisco | $6.65M | $13.34M (Aug 2026) | 3.7 / 5 | Above |
| Presidio Heights, San Francisco | $6.65M | $8.03M (Aug 2026) | 4.2 / 5 | Above |
| Upper Rockridge, Oakland | $3.00M | $2.08M (Aug 2026) | 3.9 / 5 | Below |
| Crocker Highlands, Oakland | $3.00M | $1.99M (Aug 2026) | 4.3 / 5 | Below |
| Montclair, Oakland | $3.00M | $1.84M (Jul 2026) | 3.8 / 5 | Below |
| Orinda (citywide) | $3.00M | $1.94M (Jul 2026) | 3.8 / 5 | Below |
A word on the San Francisco rows. Pacific Heights, the ridge along Broadway and Jackson that looks down on the Marina, closes so few homes a month that a couple of $20 million sales swing the median. Its 12-month history on our page runs from $6.7 million last September to $13.3 million in August, and the August figure says more about which houses traded than what the block is worth. Presidio Heights next door, with better schools and a 4.2 overall score, is the steadier read at about $8 million.
Reading a 39 percent jump when your budget stops at $1.5 million
Volume at the top does not set the price of a $1.2 million condo. Here is what the report tells you and what it does not.
- It does not mean prices moved 39 percent. Closings did. Redfin's June report had the San Francisco metro median up 9.2 percent year over year, which is a different number.
- It does mean the San Francisco middle got busier. Middle-market sales rose 15.1 percent, so a buyer near the city median (about $2.2 million in August 2026 on our San Francisco city page) faces more competition than a year ago.
- It does not mean Oakland's middle is heating up. At 3.9 percent, an East Bay buyer between the $974,000 city median and the $3 million luxury line saw almost no change in competition.
- It does not yet include the IPO money. The first half of 2026 predates any OpenAI or Anthropic lockup expiration, and Redfin estimates employees of the two companies could buy 29 percent of San Francisco metro homes and about 22 percent of Oakland metro homes with their combined proceeds.
That last point is the one to hold onto. Redfin's June numbers had San Francisco closed sales up 23.1 percent across all tiers before a single lockup opened. The IPO wealth analysis is a ceiling, not a forecast, but it is why NPR this week called the city's problem a shortage of mansions, not of buyers.
The upside for the middle is the trade-up chain. When a $2.5 million Noe Valley owner sells to buy at $4.5 million, that $2.5 million house comes back to market, and part of San Francisco's 15.1 percent middle-market gain is that chain working. In the East Bay it has not started.
Three questions the luxury numbers raise
What counts as a luxury home in San Francisco in 2026? The top 5 percent of the metro by price. The median sale inside that tier was about $6.65 million for the three months ending May 2026, with the floor near $3.1 million. The Oakland metro tier centers on about $3 million.
Is the Oakland luxury market actually growing? Sales, yes: up 13.3 percent in the first half of 2026. Prices, no: the Oakland luxury median slipped 1.8 percent in the May window. And most of those sales are in Piedmont, Lamorinda, and the Tri-Valley, not Oakland proper.
Will this push up prices under $1.5 million? Not directly. Luxury volume does not price a Glenview bungalow or a SoMa condo. Watch the middle-market sales count instead. San Francisco's rose 15.1 percent, which is real pressure. Oakland's rose 3.9 percent, which is not.
The band the report skipped
Redfin measured the top 5 percent and the middle 30 percent. The band between them, roughly $1.5 million to $3 million in the East Bay and $2.2 million to $3 million in the city, is where a large share of Bay Area buyers with real budgets shop, and it has no line in this report. Upper Rockridge, Crocker Highlands, Montclair, and most of Orinda live there.
So when the next luxury headline lands, ask which metro, which dollar line, and which tier. Then check what the neighborhood you are comparing has closed at over twelve months rather than one. That is the habit we built Houseberry's neighborhood pages around, and it is the one that keeps you from paying for a headline.
Sources
- Associated Press via Local 10, AI boom heats up Bay Area housing market as wealthy buyers drive demand for high-end homes across US, Sept. 2, 2026
- Redfin, A Tale of Two Markets: Luxury Home Prices Are Rising 3 Times Faster Than Non-Luxury Prices, June 30, 2026
- Redfin, Luxury Home Prices Rise Amid Uptick in High-End Homebuying and Selling, May 26, 2026
- Redfin, U.S. Home Prices Hit All-Time High, Driven in Part By Big Upticks in San Francisco and West Palm Beach, July 13, 2026
- Redfin, OpenAI, Anthropic Employees Could Buy Nearly One-Third of All Homes in San Francisco With IPO Earnings, July 9, 2026
- Fortune, AI is quietly splitting the housing market in two, May 7, 2026
- NPR, AI wealth is creating a mansion shortage and upending San Francisco's housing market, Sept. 1, 2026
- Houseberry, How AI Is Splitting the Bay Area Housing Market
- Houseberry, IPO Money Is Coming for These Bay Area Neighborhoods
The Houseberry Research Team is Houseberry's reporting team: Bay Area real estate analysts, data specialists and longtime local market watchers. Every day we check the public record: building permits, city council and planning agendas, county recorder filings, state housing bills, police incident data and school results. Then we tie each story to what it means for specific neighborhoods, using Houseberry's own neighborhood data on prices, appreciation, safety, schools and amenities. Questions or corrections: Contact us.
All information provided on this website including but not limited to - school ratings, safety, amenities, user opinions, and property data - is for general informational purposes only. We do not guarantee its reliability, accuracy, or completeness. Users should independently verify information and consult appropriate professionals as needed. By using this website, you agree Houseberry is not responsible for actions, decisions, or consequences arising from reliance on the information provided
houseberry.com - CA DRE# 01847391
 Bay East ©2025. CCAR ©2025. bridgeMLS ©2025. Information Deemed Reliable But Not Guaranteed. This information is being provided by the Bay East MLS, or CCAR MLS, or bridgeMLS. The listings presented here may or may not be listed by the Broker/Agent operating this website. This information is intended for the personal use of consumers and may not be used for any purpose other than to identify prospective properties consumers may be interested in purchasing. Data last updated at October 22, 2026 12:00 AM