SF is putting flood barriers on the Embarcadero for El Niño
The Port of San Francisco is installing temporary flood barriers along the Embarcadero and at Piers 45, 80 and 96 before a strong El Niño winter. Here is where they go and how the neighborhoods behind them compare on flood risk.

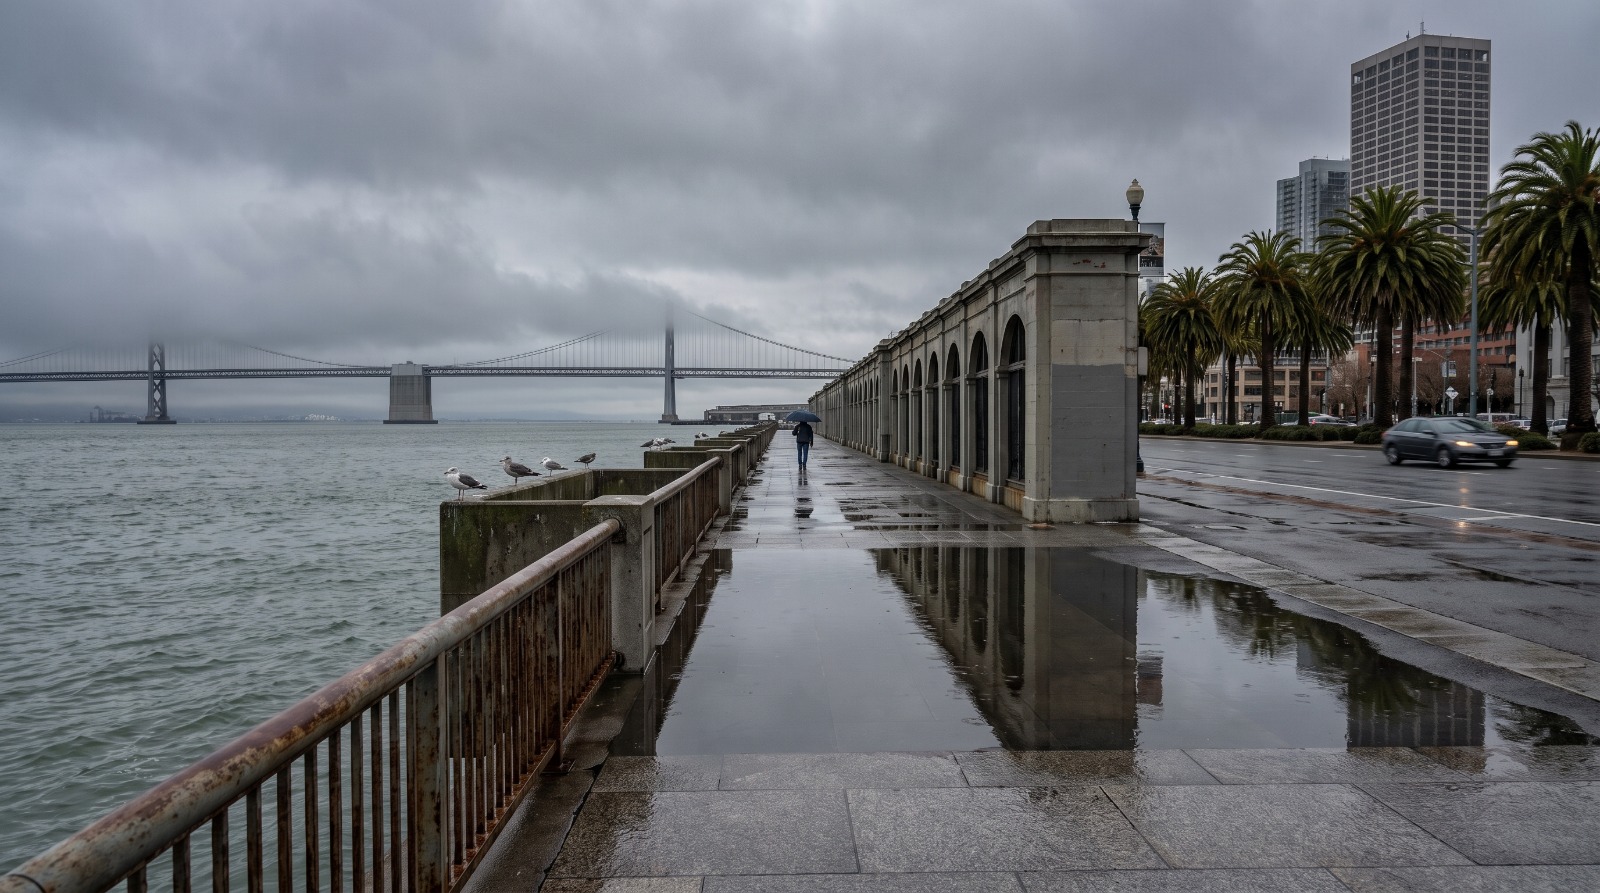
AI-rendered view of the wet Embarcadero Promenade and seawall in San Francisco after rain, looking toward the Bay Bridge Photo: Houseberry
Walk the Embarcadero Promenade south from the Ferry Building toward the Bay Bridge and the bay sits on your left, a few feet below the top of a seawall that was finished in 1916. This winter, a line of temporary flood barriers goes in along that walk.
The Port of San Francisco filed the plan on October 7 as the "Super El Niño Emergency Project," Planning record 2026-008828PRJ, and the Planning Department cleared it with an environmental exemption the same day. It covers four spots: the promenade from Mission to Harrison streets, the Pier 45 parking lot at Fisherman's Wharf, the foot of Pier 80 in the Central Waterfront and the southern edge of Pier 96 near India Basin.
For anyone who lives or owns near the water, the list doubles as the Port's own map of where it expects the bay to come over first. Houseberry's flood mapping puts 4.3 percent of South Beach, the neighborhood behind that stretch of promenade, inside FEMA's 1 percent flood zone, with another 10.5 percent in the lower-risk 0.2 percent zone.
What goes where
The filing describes "fixed and deployable elements." Picture low walls that stay put, with gates or panels that crews close when a storm is coming.
On the promenade, the barriers run from Mission Street to Harrison Street, Piers 2 to 22½. That is the stretch past Rincon Park and Pier 14 down to Fire Station 35, the fireboat house at Pier 22½. At Pier 45, one barrier crosses the parking lot. Pier 45 holds what the Port calls the West Coast's largest concentration of commercial fish processors. At Pier 80, a cargo pier, it goes in the lot at the foot of the pier. At Pier 96, home to Recology's Recycle Central, it runs along the southern edge.
The record says the barriers protect "the fish processing center and the recycling center." It does not say which is where, but those two descriptions match Pier 45 and Pier 96.
What the filing leaves out matters too. Nobody has said how tall they are. It gives no height, no length, no materials and no cost. It says no digging is planned and the work is reversible, and the barriers stay "for the duration of the El Niño period, expected to be during Winter 2026/2027." Because they sit east of the roadway, the record says buses, streetcars and cars on the Embarcadero are not blocked.
Why these four spots
The seawall under the Embarcadero was built between 1878 and 1916 in 21 sections and runs about three miles. When the Chronicle measured it in 2016, it stood roughly five feet above the average high tide. The Port's 2019 bond report said the stretch from Pier 9 to Pier 22 has some of the lowest ground on the waterfront, floods during king tides, and would be overtopped in a 100-year flood. The bay has risen more than eight inches since 1900, according to the same report.
This has happened before. On February 3, 1998, during the last very strong El Niño, the tide at Fort Point ran about two feet above prediction and waves splashed over the Embarcadero, the U.S. Geological Survey recorded. Port Director Michael Martin put it plainly to the SF Standard in August: "We know the hot spots, the drains that will likely flood."
The forecast is why the Port is moving now. The Climate Prediction Center's October 8 discussion put the key ocean reading at 2.1 degrees Celsius above normal and gave 83 percent odds that the October to December average tops anything since 1950. Governor Newsom's September 21 proclamation told state agencies to speed up permits for storm prep, and this filing cites it.
The neighborhoods behind the barriers
Here is what Houseberry's data shows for the neighborhoods next to each barrier site. Flood shares come from our October 6 overlay of FEMA's flood map on every Houseberry neighborhood. Prices are the typical home value from each neighborhood's price history for September 2026.
| Barrier site | Neighborhood next to it | Overall score | In FEMA 1% zone | In FEMA 0.2% zone | Typical home, Sep 2026 |
|---|---|---|---|---|---|
| Piers 2 to 22½ | South Beach | 3.1 | 4.3% | 10.5% | $1.23M |
| Pier 45 | North Waterfront | 3.3 | 3.1% | 1.3% | n/a |
| Pier 80 | Central Waterfront/Dogpatch | 2.9 | 7.4% | 1.3% | n/a |
| Pier 96 | Bayview | 2.4 | 3.4% | 1.6% | $1.10M |
| None (between Piers 80 and 22½) | Mission Bay | 3.3 | 4.0% | 32.5% | $1.50M |
The surprise is the last row. Mission Bay gets no barrier in this filing, yet a third of its land sits in FEMA's 0.2 percent zone, the largest share of any of San Francisco's 92 Houseberry neighborhoods. Most of that land was bay or rail yard a century ago.
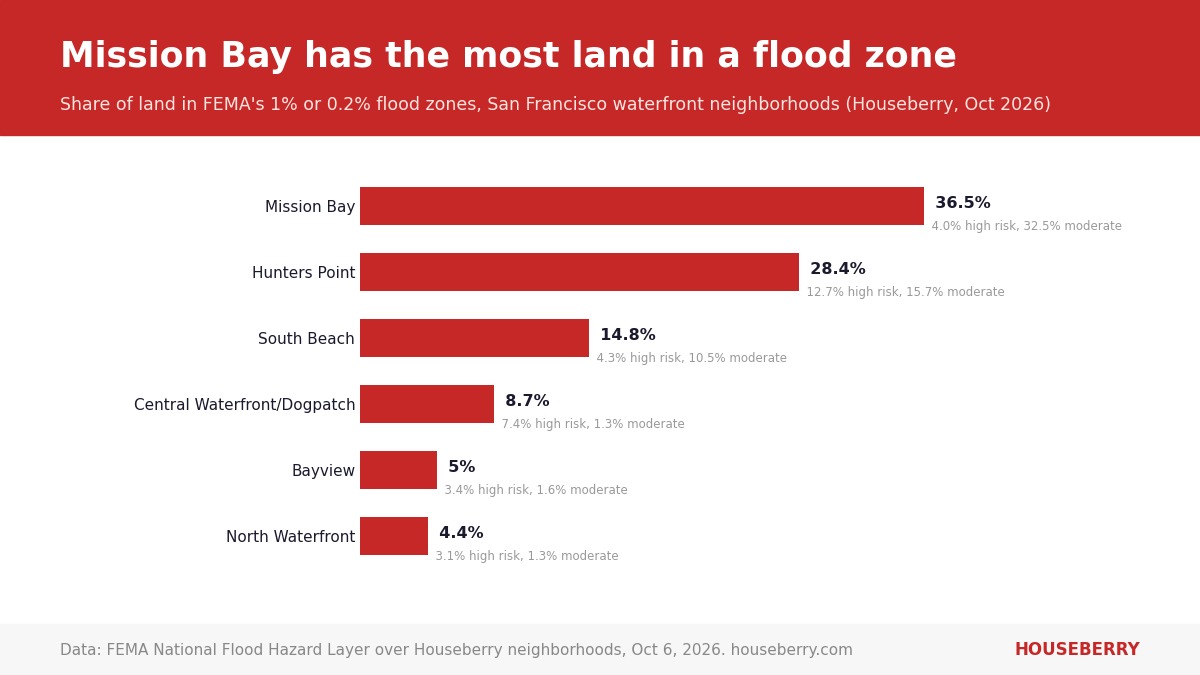
The other finding is how small most of these shares are. Only Hunters Point, at 12.7 percent, has more than a tenth of its land in the 1 percent zone among the waterfront neighborhoods we checked. The risk on the Embarcadero is concentrated in the strip between the roadway and the water, which is exactly where the Port is putting the barriers. Prices have held steady in the two neighborhoods with clean price data: South Beach rose from about $1.19 million in October 2025 to $1.23 million in September 2026, and Mission Bay from $1.47 million to $1.50 million.
What this does and does not fix
We think this is the right call. It is cheap, it is temporary, it targets the low spots the Port already knows about, and it goes in before the storms instead of after them.
It is also a patch on a much bigger bill. The Army Corps of Engineers' final study for the waterfront, released July 31, 2026, recommends a plan costing about $17.8 billion for 7.5 miles of shoreline, and voters approved a $425 million seawall bond back in 2018. Temporary barriers do not change FEMA's maps, your insurance or your disclosure forms.
If you own or are buying near the water, three things are worth checking this fall: whether the parcel sits in FEMA's zones, whether it shows up on the city's own 100-year storm map for sewer flooding, and whether the building has a below-grade garage. Houseberry's earlier look at Bay Area flood zones by neighborhood covers how to read both maps.
The first real test is the king tide on November 24. Before then, you can compare South Beach, Mission Bay and every other waterfront neighborhood on Houseberry's San Francisco neighborhood ranking.
Sources
- San Francisco Planning, project record 2026-008828PRJ
- Office of the Governor: El Niño state of emergency, September 21, 2026
- NOAA Climate Prediction Center: ENSO diagnostic discussion
- Port of San Francisco: Embarcadero Seawall Program
- U.S. Geological Survey Fact Sheet 175-99 on the 1997 to 98 El Niño
- California Coastal Commission: King Tides Project
- SF Standard: the Port director on El Niño, August 27, 2026
The Houseberry Research Team is Houseberry's reporting team: Bay Area real estate analysts, data specialists and longtime local market watchers. Every day we check the public record: building permits, city council and planning agendas, county recorder filings, state housing bills, police incident data and school results. Then we tie each story to what it means for specific neighborhoods, using Houseberry's own neighborhood data on prices, appreciation, safety, schools and amenities. Questions or corrections: Contact us.
Map of San Francisco Neighborhoods
Loading map...
View Full Map
Top Neighborhoods in San Francisco, CA


All information provided on this website including but not limited to - school ratings, safety, amenities, user opinions, and property data - is for general informational purposes only. We do not guarantee its reliability, accuracy, or completeness. Users should independently verify information and consult appropriate professionals as needed. By using this website, you agree Houseberry is not responsible for actions, decisions, or consequences arising from reliance on the information provided
houseberry.com - CA DRE# 01847391
 Bay East ©2025. CCAR ©2025. bridgeMLS ©2025. Information Deemed Reliable But Not Guaranteed. This information is being provided by the Bay East MLS, or CCAR MLS, or bridgeMLS. The listings presented here may or may not be listed by the Broker/Agent operating this website. This information is intended for the personal use of consumers and may not be used for any purpose other than to identify prospective properties consumers may be interested in purchasing. Data last updated at October 9, 2026 12:00 AM