

Belmont, CA




At a glance
Belmont has 9 ranked neighborhoods on Houseberry, with a citywide overall score of 4.1/5. Neighborhood overall scores range from 4.6/5 in Belmont Heights to 3.8/5 in Homeview. Belmont scores 3.6/5 for safety, 5.0/5 for schools and 3.5/5 for amenities. The typical home price across its priced neighborhoods is $2.43M.
City Reviews & Questions

Belmont is a charming city on the San Francisco Peninsula, known for its rolling hills, serene residential areas, and excellent access to outdoor recreation. Nestled between San Mateo and San Carlos, Belmont offers a small-town vibe while remaining well-connected to the greater Bay Area via highways 101 and 280, as well as the Caltrain line. The city is a haven for nature enthusiasts, with the Waterdog Lake & Open Space serving as its crown jewel. This area features hiking and biking trails, picnic spots, and scenic views of the surrounding hills. Nearby, Laurelwood Park and the Waterdog Hiking North Trailhead extend the city's outdoor appeal, offering a mix of challenging trails and peaceful open spaces. Belmont boasts a strong sense of community, with events like the Belmont Farmers Market bringing residents together to enjoy fresh produce and artisan goods. The city’s schools, part of the highly regarded Belmont-Redwood Shores School District, are a significant draw for families. Notre Dame de Namur University, located within Belmont, adds an academic and cultural touch to the city’s landscape. While primarily residential, Belmont has a quaint downtown area featuring local favorites like coffee shops, restaurants, and small businesses. The city also benefits from proximity to larger retail centers in neighboring San Mateo and Redwood City. Belmont’s charm lies in its balance: the city is peaceful and suburban while offering easy access to urban amenities. Its tree-lined streets, well-maintained homes, and hilly vistas create an inviting atmosphere that appeals to families, professionals, and retirees alike.
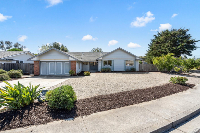
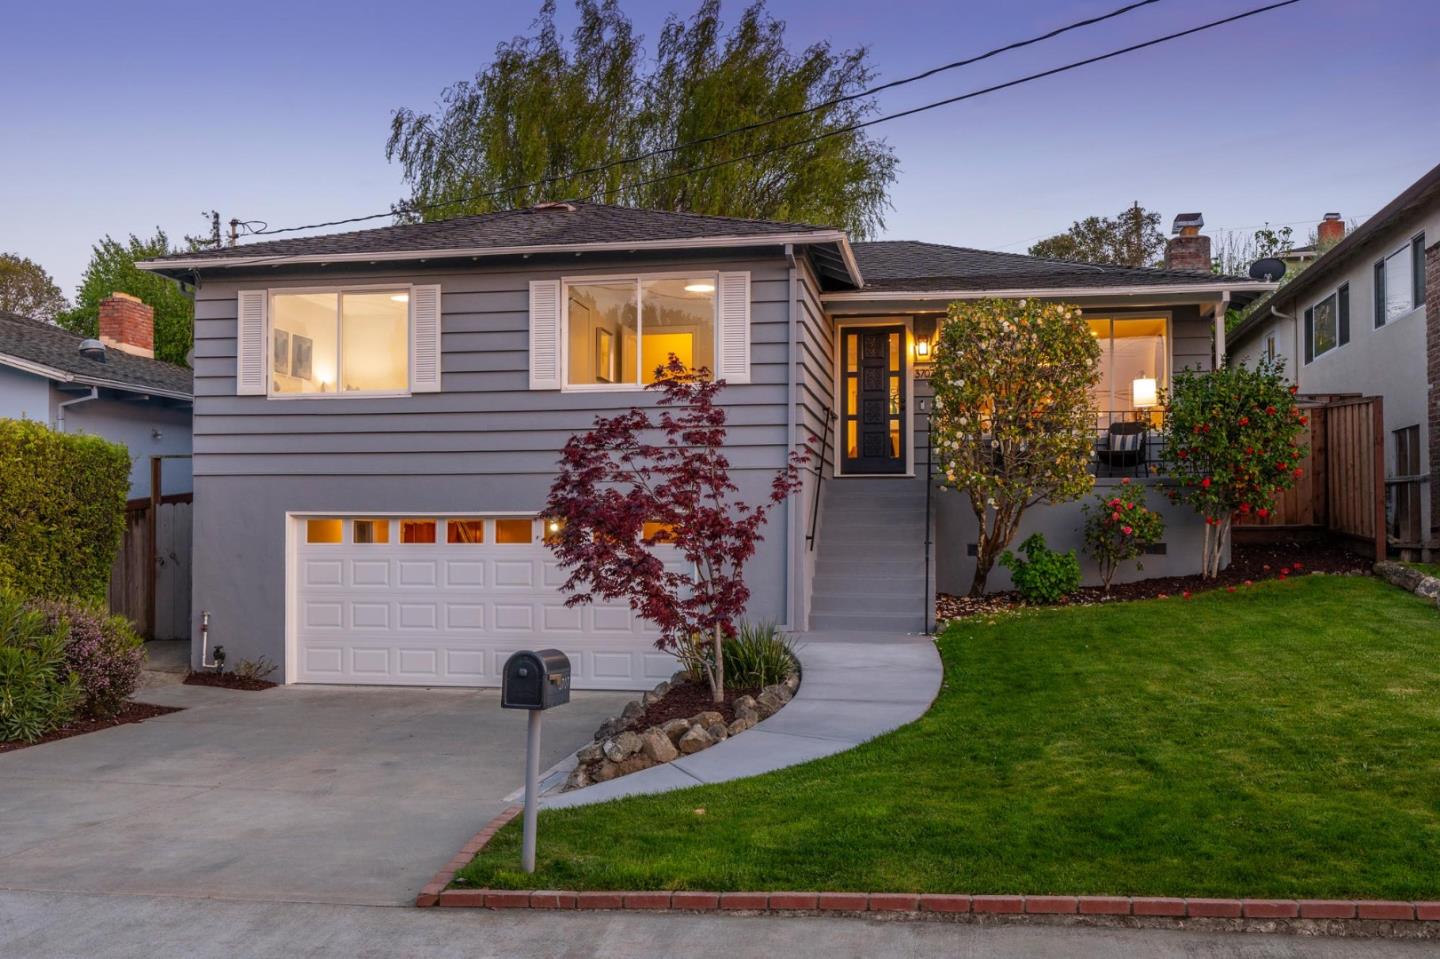
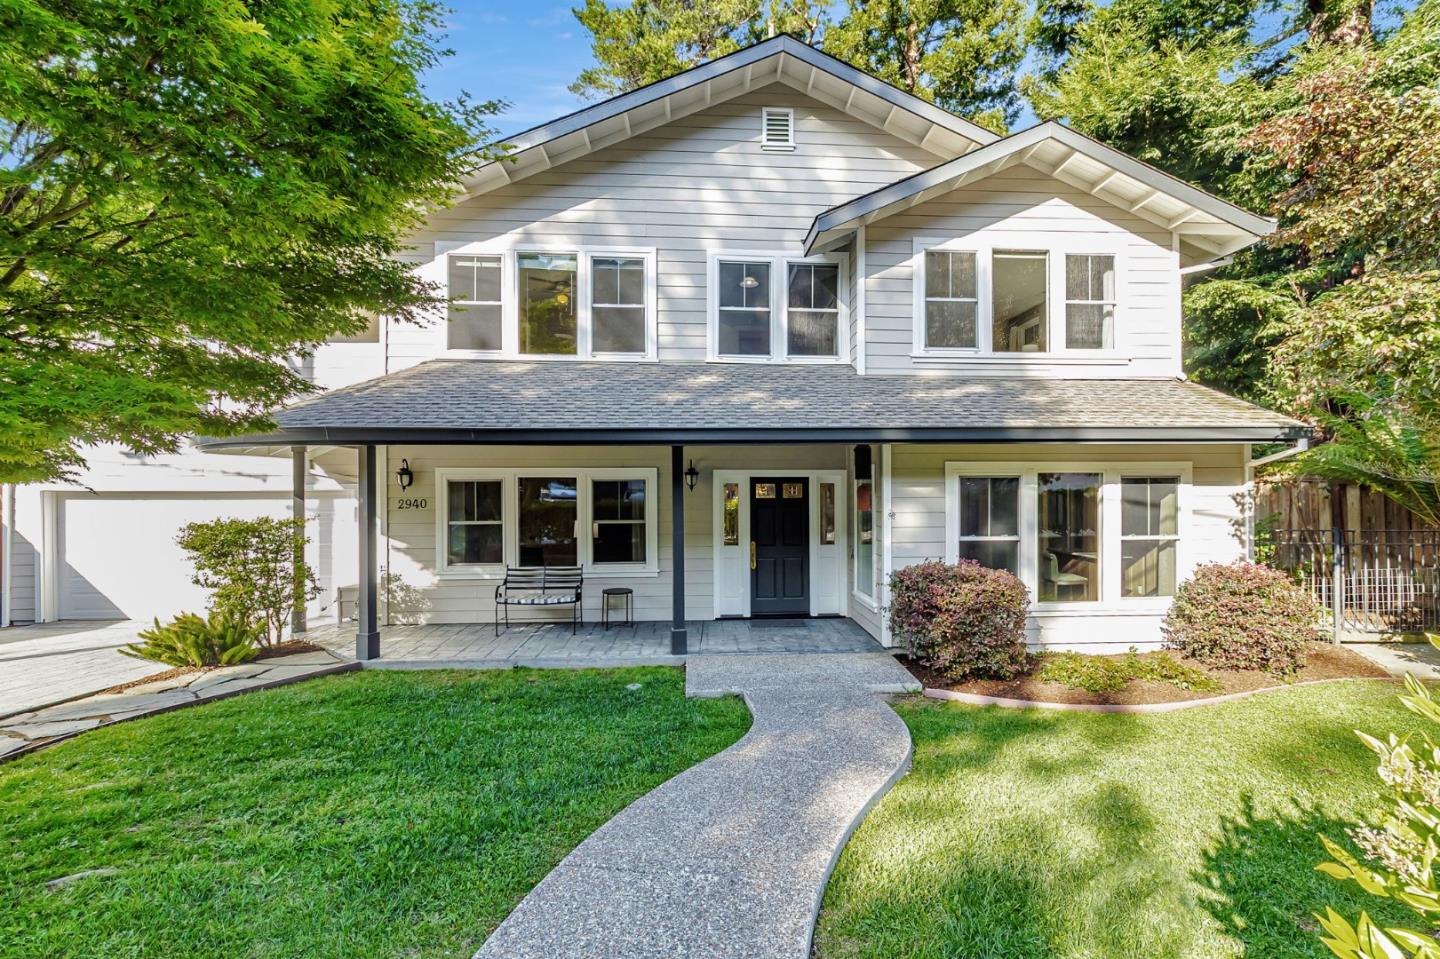
Top Neighborhoods in Belmont, CA(9 ranked)


City Amenities
 Near good merchants
2.6
 Public Spaces
3.9
 Curb Appeal
3.7
Overall Amenities score: 3.5
City Weather
City Photos
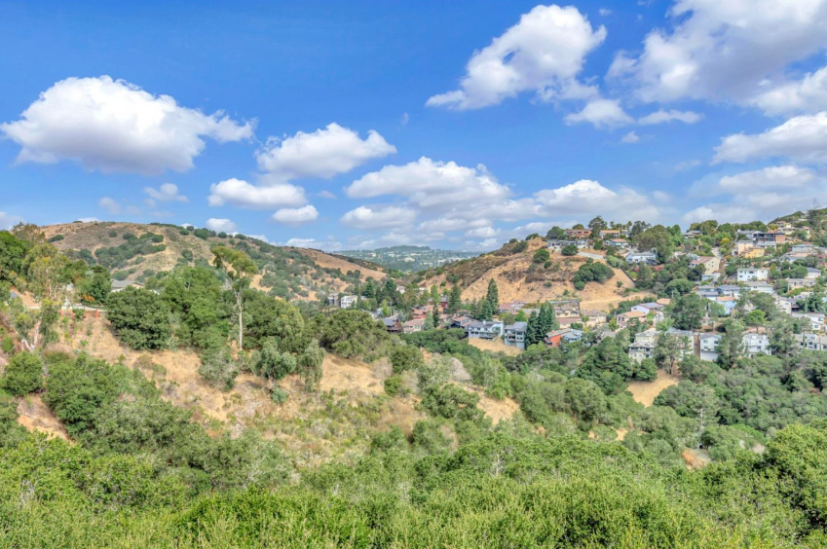
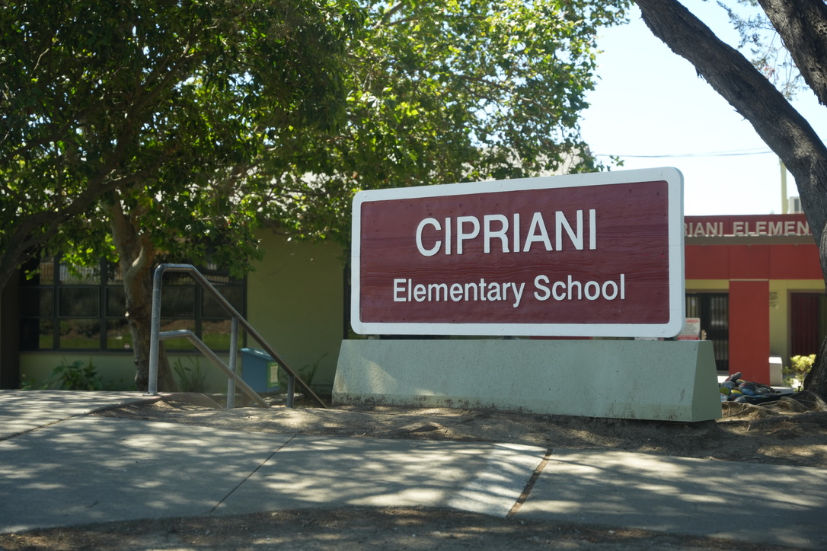
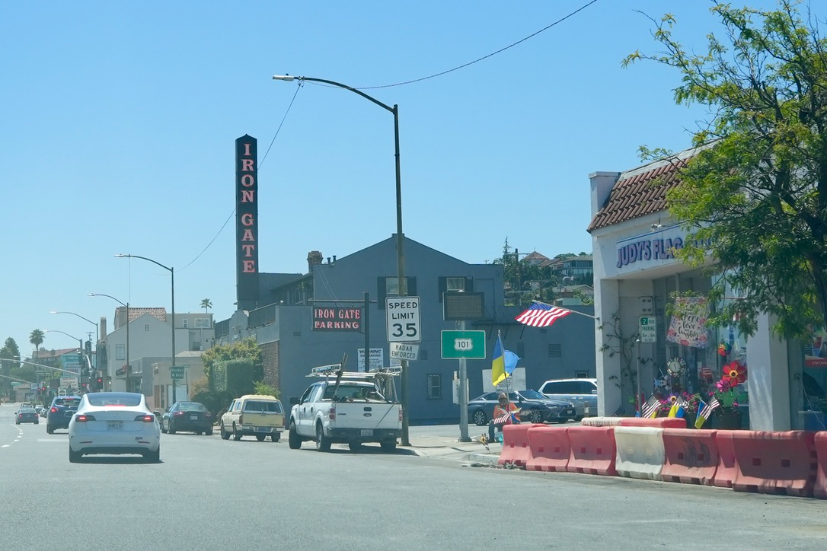
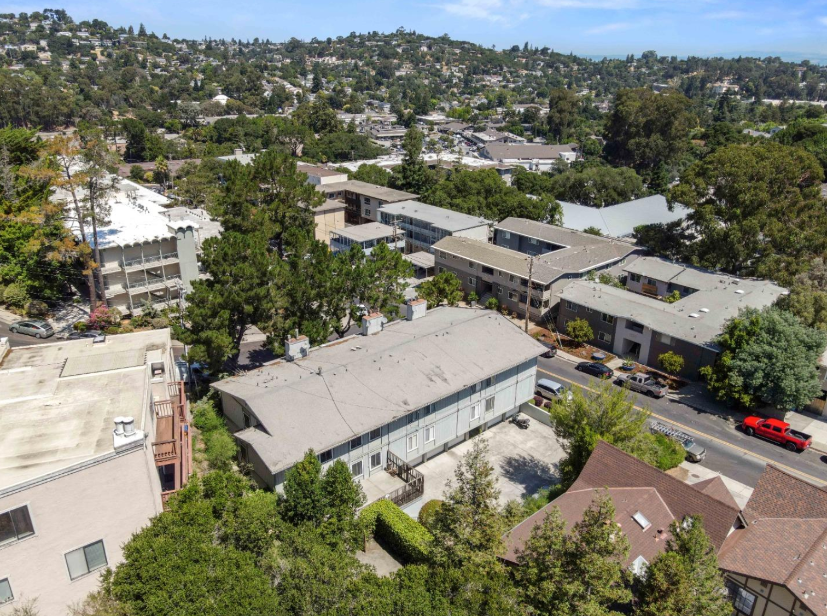
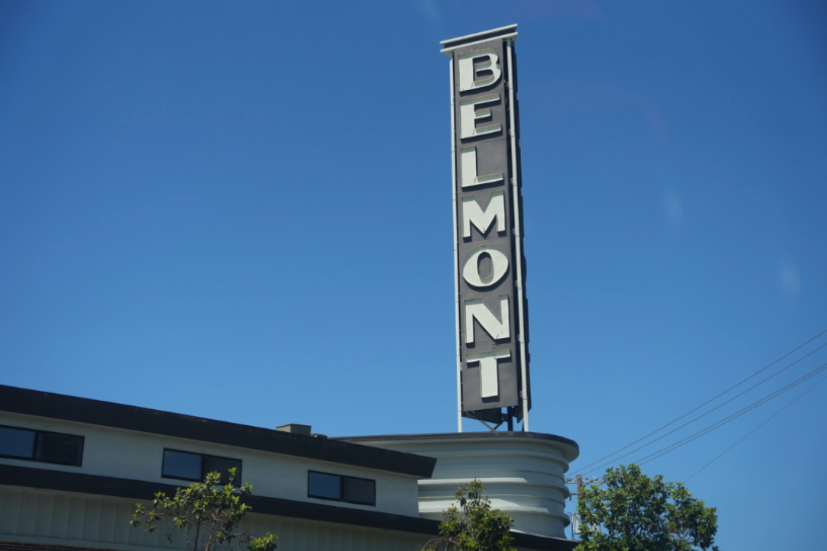
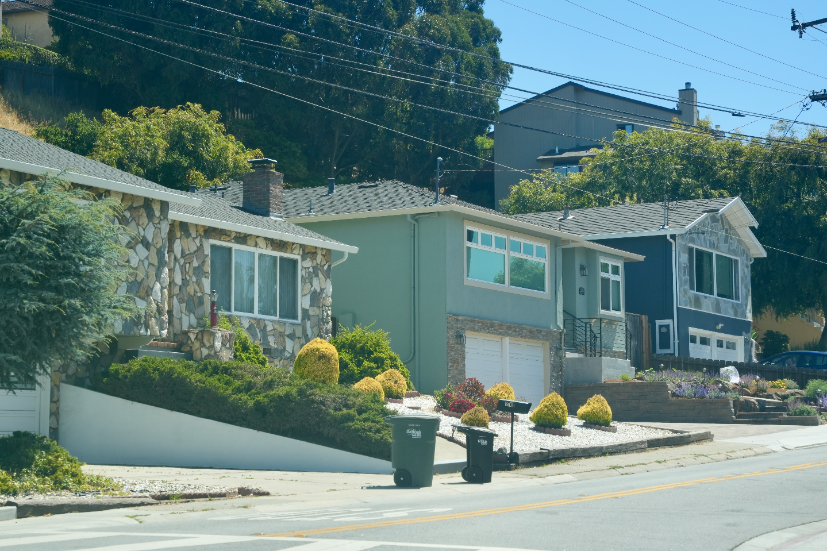
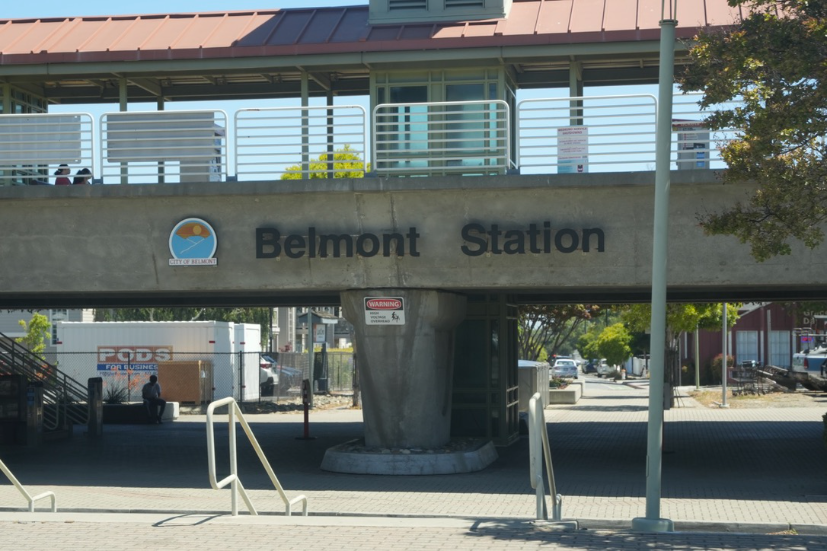
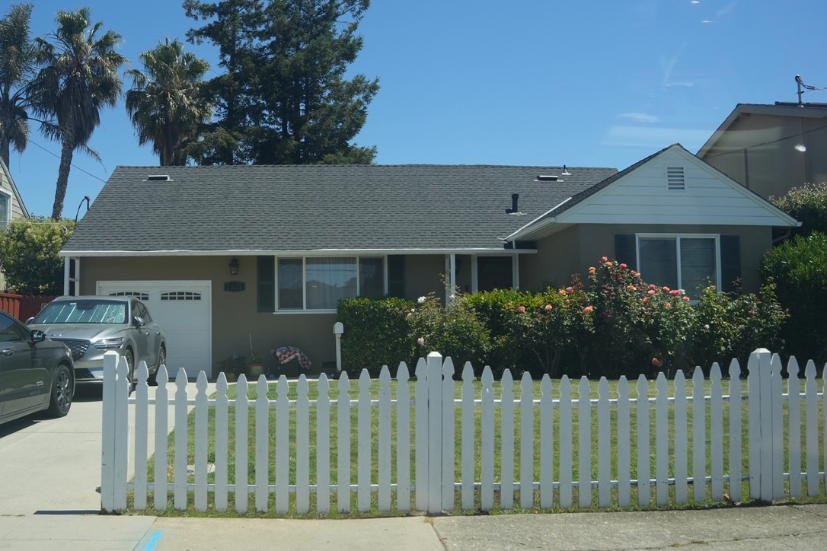
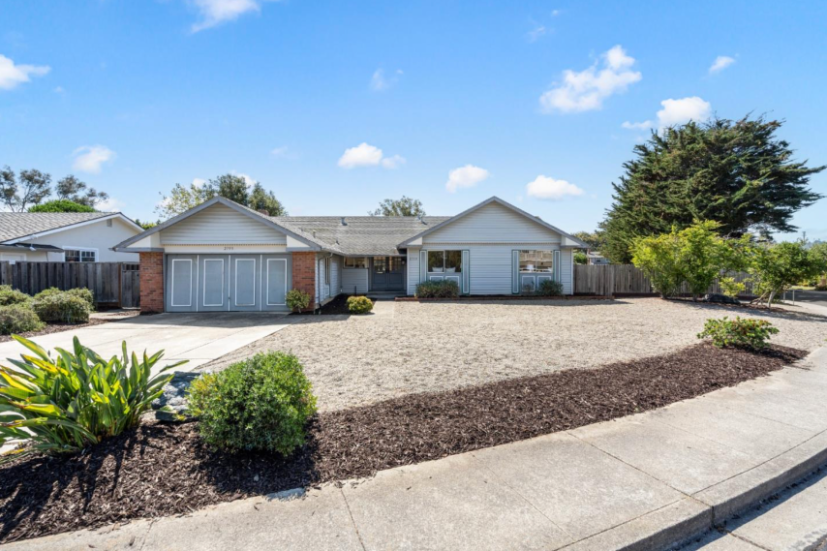
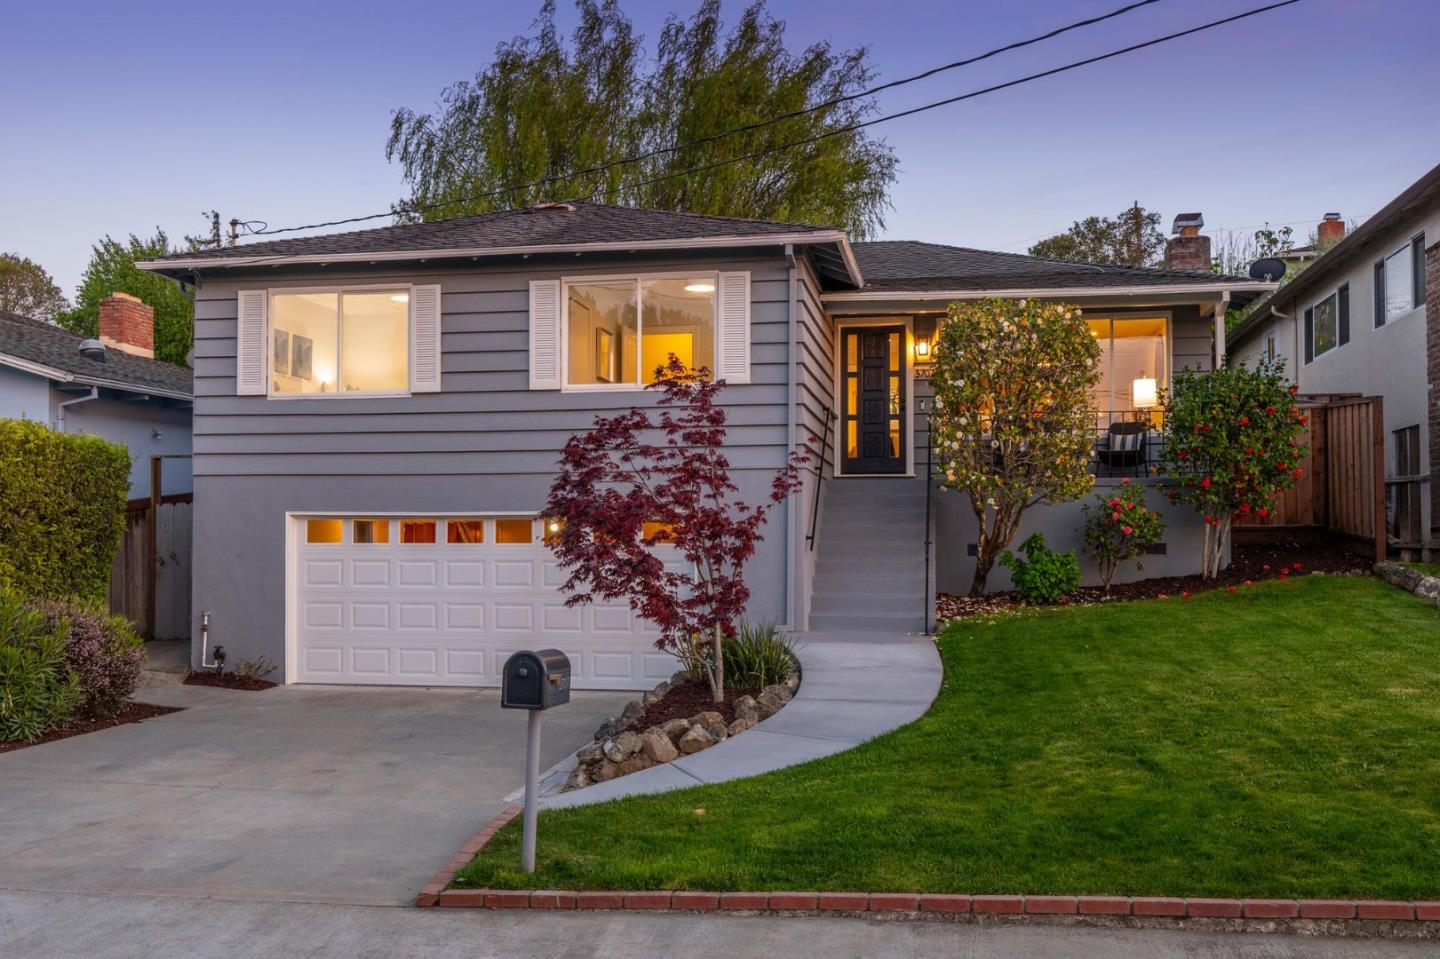
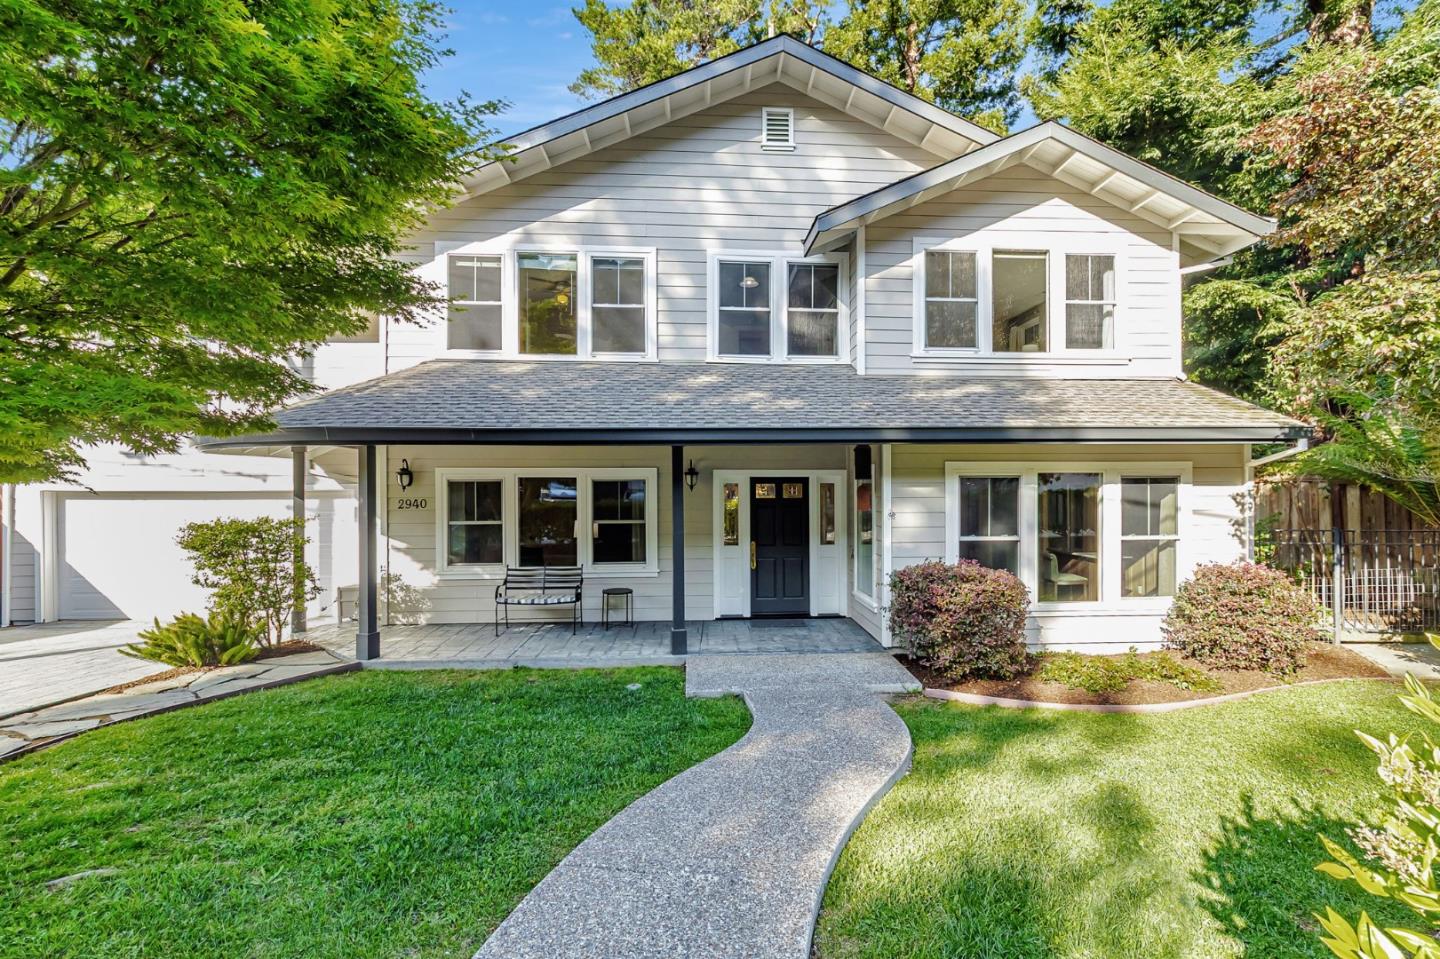
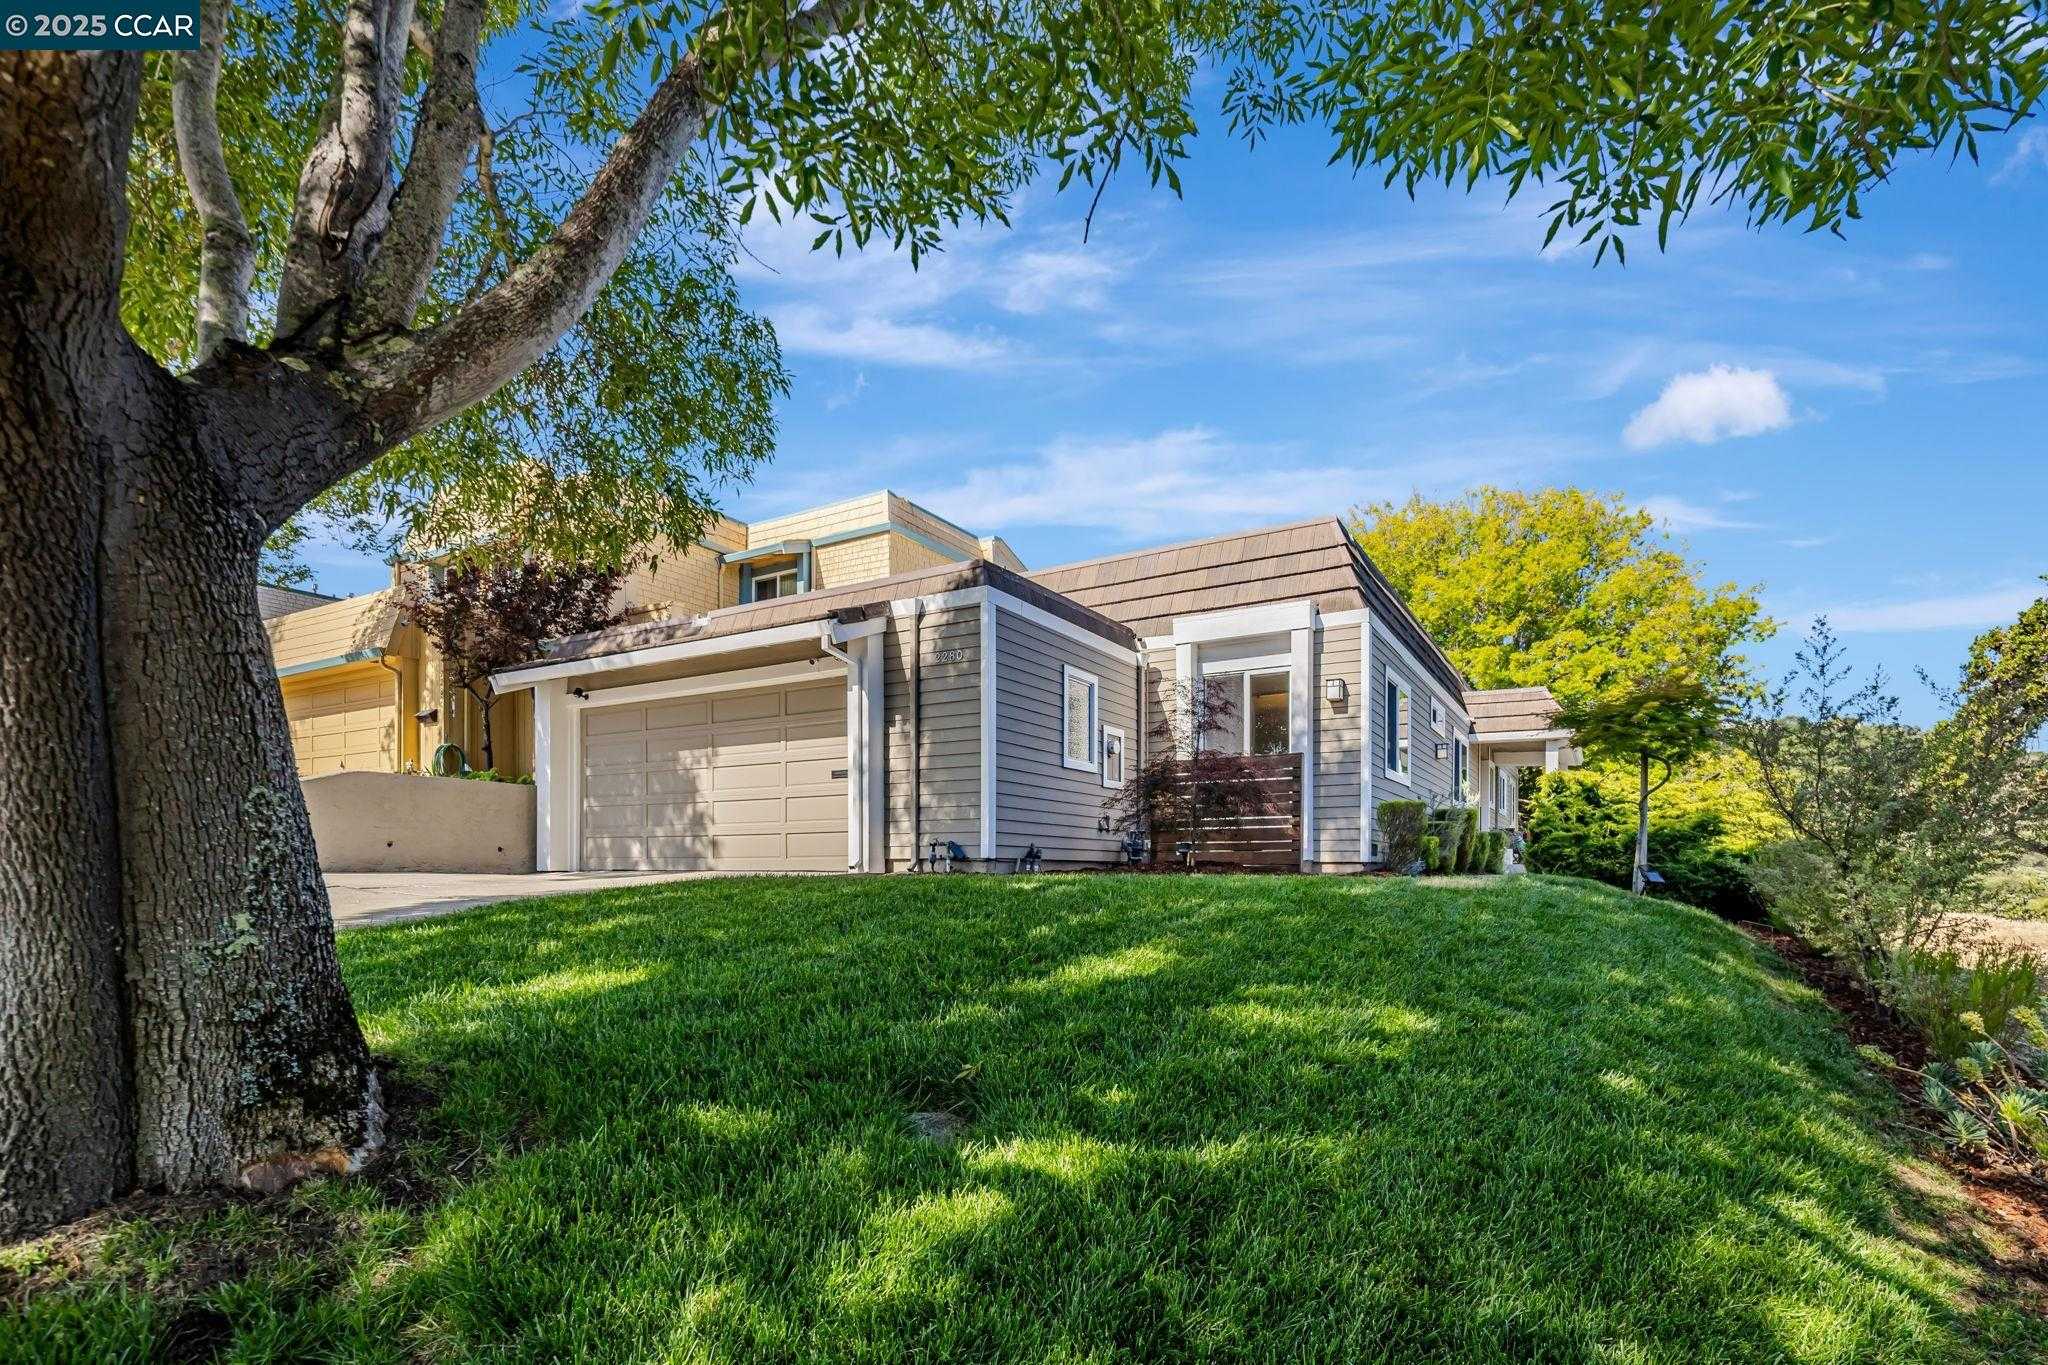
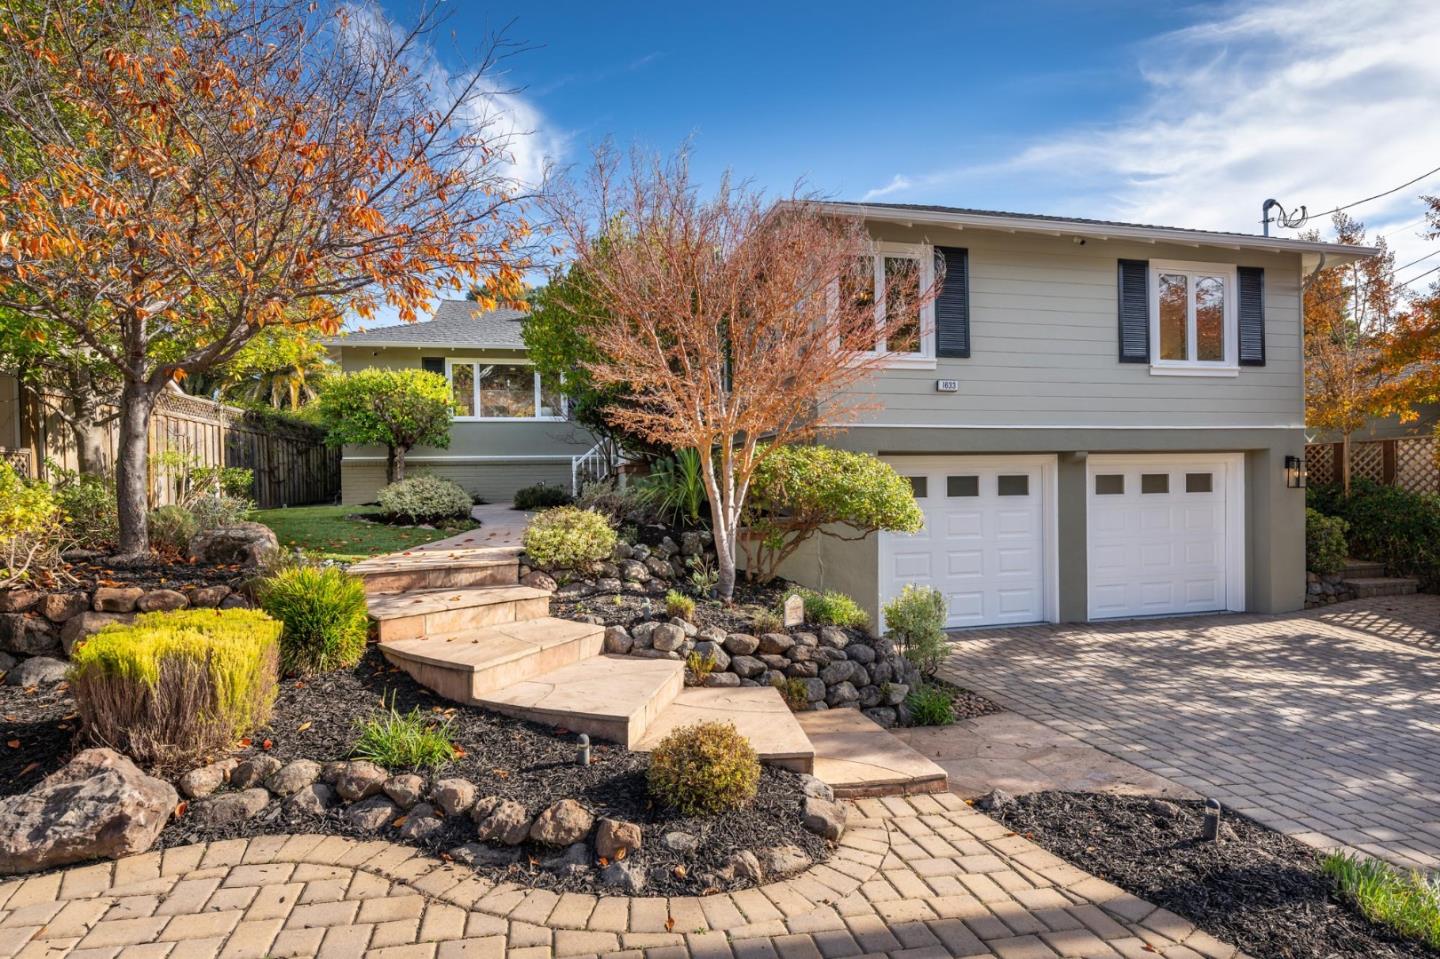
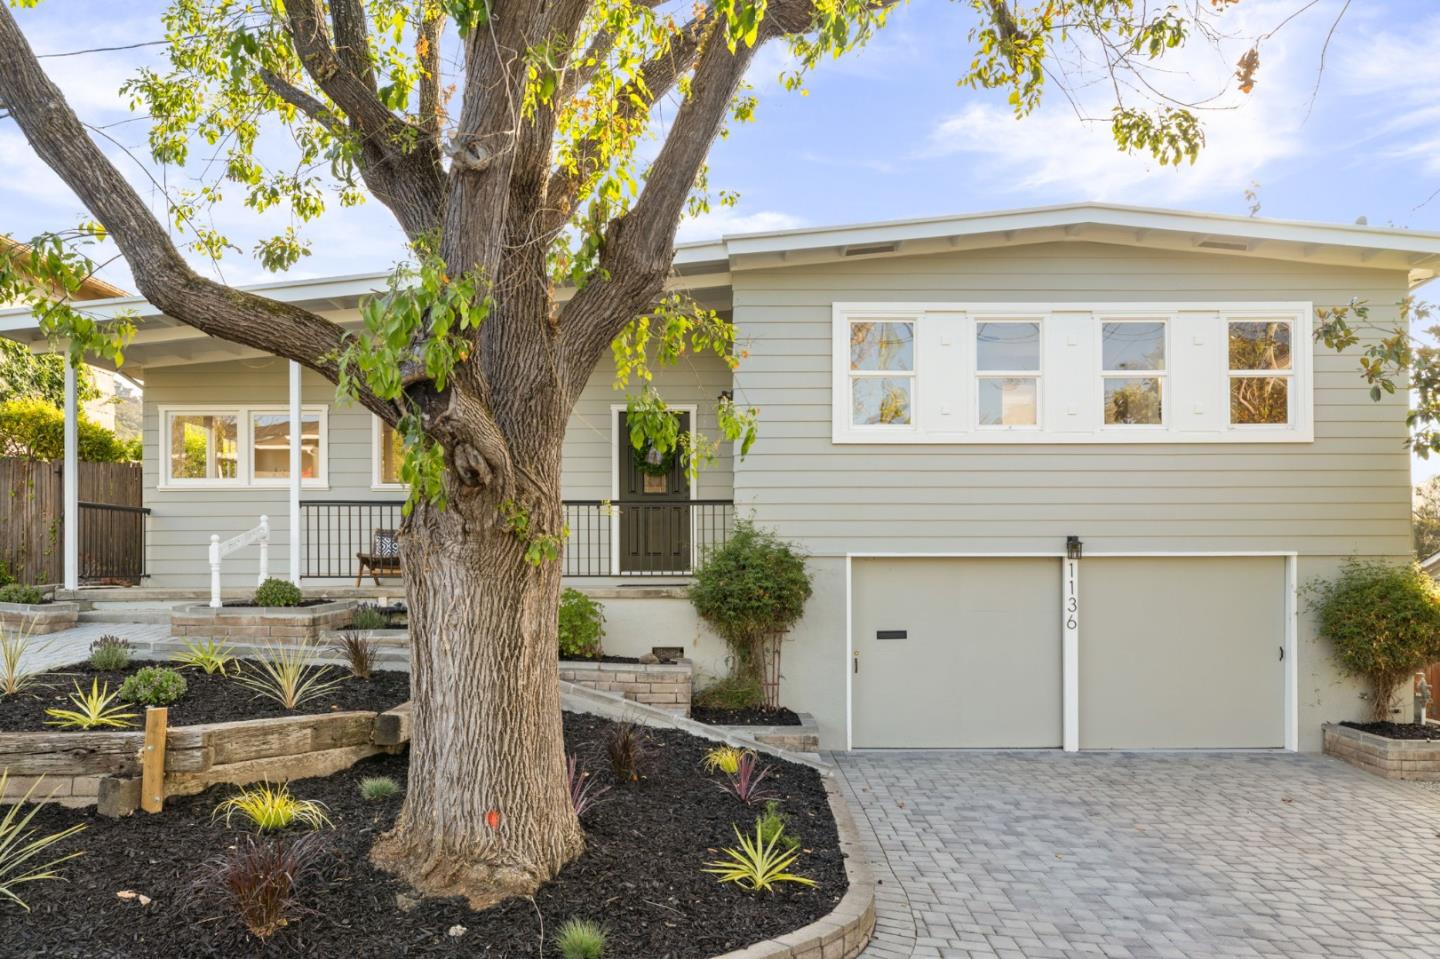
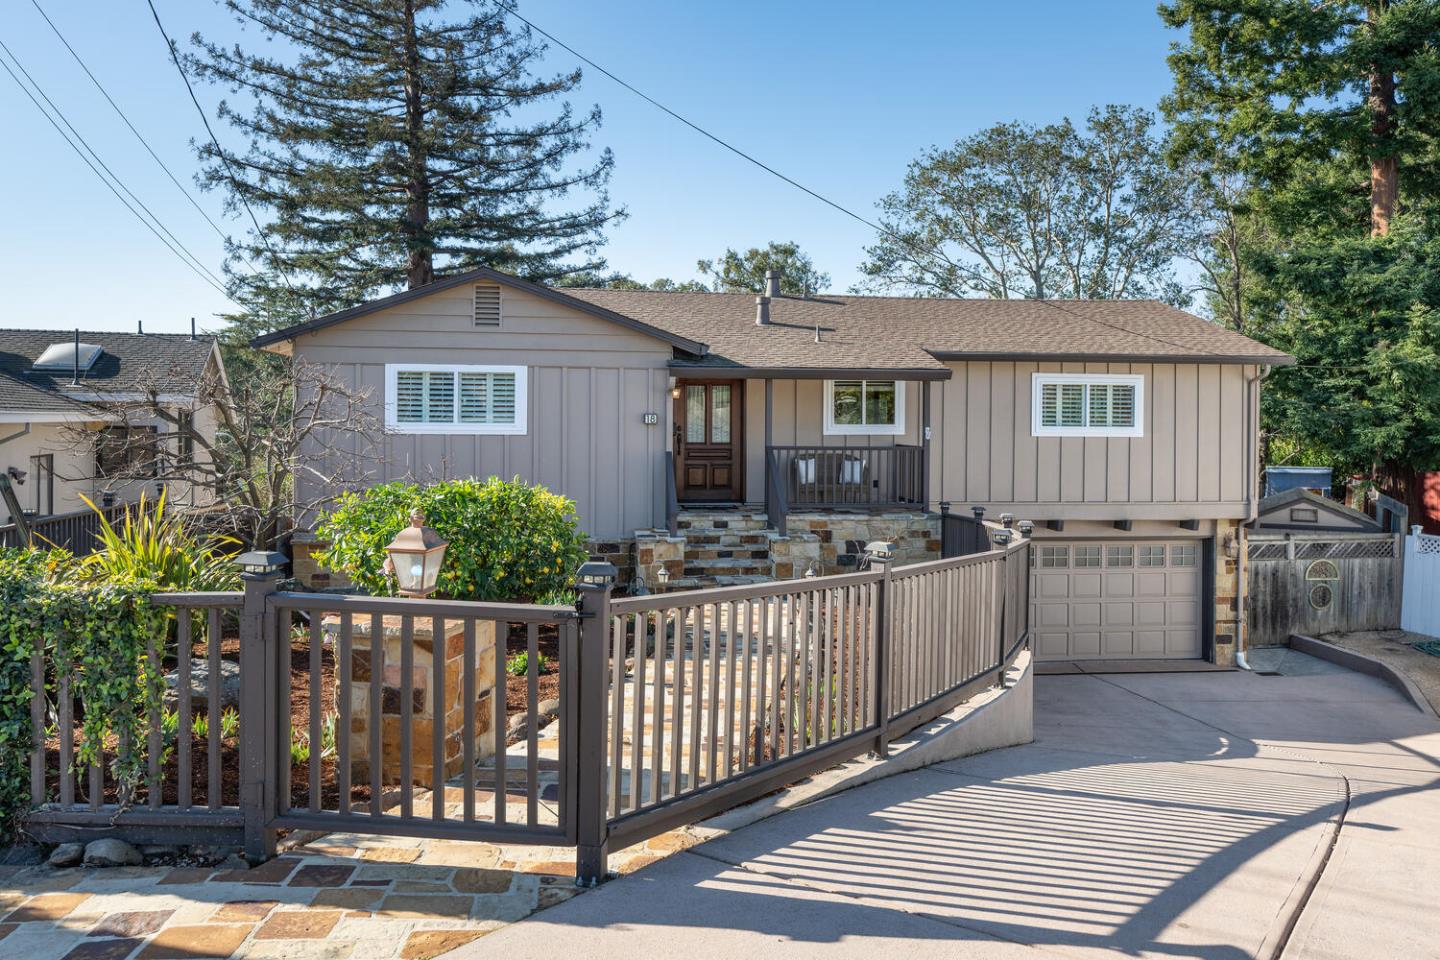
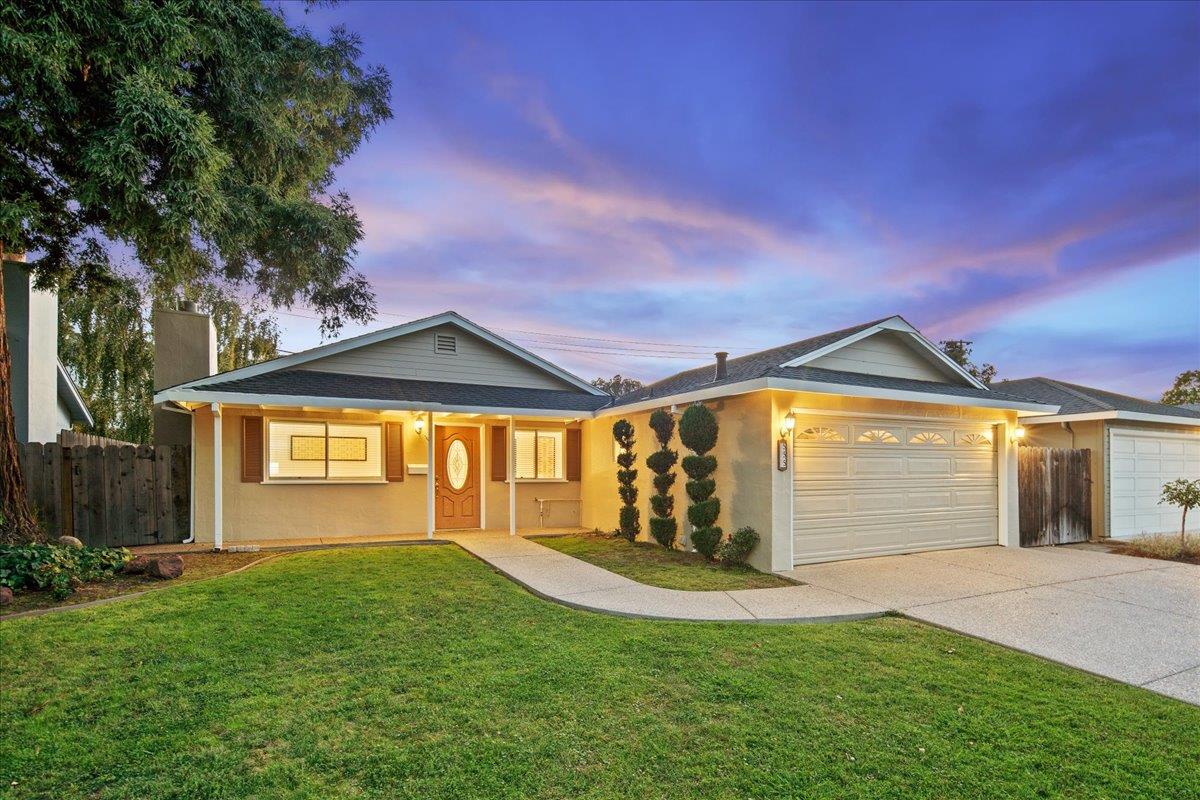
1 of 16
Schools serving this City
| School Name | Type | Grades | Houseberry School Score |
|---|---|---|---|
| Nesbit Elementary | Primary | K-8 | |
| Cipriani Elementary | Primary | K-5 | |
| Ralston Intermediate | Middle | 6-8 | |
| Carlmont High | High | 9-12 |
Click links for school listing
info at GreatSchools.org
Houseberry School Score Data
from CA Dept. of Education
Houseberry recommends using these scores as only a starting point, and conducting your own investigation into what schools fit best for your preferences. School boundaries are not guaranteed and may change. It is important to contact the appropriate school district to confirm enrollment eligibility before making any decision to move to a neighborhood.
Typical Home Price
Belmont FAQs8 answers
Is Belmont safe?
Belmont has a citywide safety score of 3.6/5 on Houseberry. Across its ranked neighborhoods safety scores run from 2.9/5 to 4.5/5, with Belmont Heights the highest-scoring. 3 of its 9 ranked neighborhoods score 4.0/5 or higher for safety.
How much does a home cost in Belmont?
The typical home price across Belmont's priced neighborhoods is $2.43M. Neighborhood typical home prices run from $1.92M to $3.46M across the 8 neighborhoods with a recorded price.
What are school scores like in Belmont?
Belmont has a citywide school score of 5.0/5 on Houseberry. Neighborhood school scores run from 4.9/5 to 5.0/5, with Belmont Heights the highest-scoring. 9 of its 9 ranked neighborhoods score 4.0/5 or higher for schools.
Which Belmont neighborhoods rank highest overall?
By overall score the highest-ranked Belmont neighborhoods on Houseberry are Belmont Heights (4.6/5), Plateau-Skymont (4.5/5), Cipriani (4.4/5), Western Hills (4.1/5) and Downtown Belmont (4.1/5).
Which Belmont neighborhoods have the lowest typical home prices?
The lowest neighborhood typical home prices recorded in Belmont are Western Hills ($1.92M), Sterling Downs ($1.97M), Central ($2.11M), Cipriani ($2.44M) and McDougal ($2.5M).
Is Belmont more or less expensive than nearby cities?
Belmont's typical home price of $2.43M sits alongside San Carlos $2.34M, San Mateo $2.01M, Foster City $1.63M, Redwood City $2.21M, Hillsborough $6.64M and Woodside $5.48M among nearby cities on Houseberry.
How does Belmont rank among cities in San Mateo County?
Houseberry ranks Belmont #3 of the 22 places it scores in San Mateo County for overall score. It is #1 of 22 for schools and #10 of 22 for safety.
What amenities does Belmont have?
Belmont scores 3.5/5 for amenities on Houseberry. That is made up of 2.6/5 for nearby merchants, 3.9/5 for public spaces and 3.7/5 for curb appeal.
City Photos
1 of 16
Top Neighborhoods in Belmont, CA(9 ranked)
City Map
View Full Map
Scores updated October 2026
All information provided on this website including but not limited to - school ratings, safety, amenities, user opinions, and property data - is for general informational purposes only. We do not guarantee its reliability, accuracy, or completeness. Users should independently verify information and consult appropriate professionals as needed. By using this website, you agree Houseberry is not responsible for actions, decisions, or consequences arising from reliance on the information provided
houseberry.com - CA DRE# 01847391
 Bay East ©2025. CCAR ©2025. bridgeMLS ©2025. Information Deemed Reliable But Not Guaranteed. This information is being provided by the Bay East MLS, or CCAR MLS, or bridgeMLS. The listings presented here may or may not be listed by the Broker/Agent operating this website. This information is intended for the personal use of consumers and may not be used for any purpose other than to identify prospective properties consumers may be interested in purchasing. Data last updated at October 21, 2026 12:00 AM